Beyond the choice data · Survey Analysis
What does the rest of the questionnaire say?
Descriptives, tests and charts.
The questions around the choice tasks are analysed in the same project, with no export to a statistics package. Describe the sample, compare groups, test relationships and chart scale questions, then hand the result over as a publication-quality table in APA format.
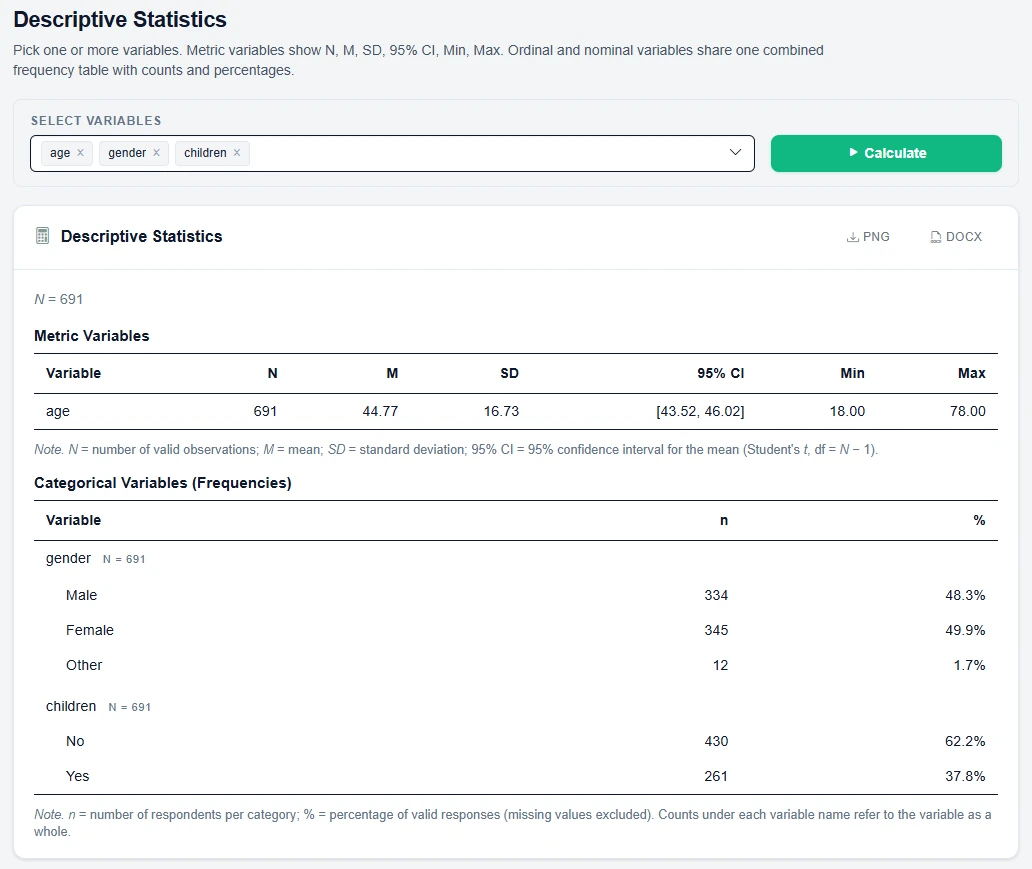
Descriptives
Publication-quality tables in APA format, downloadable as DOCX or PNG.
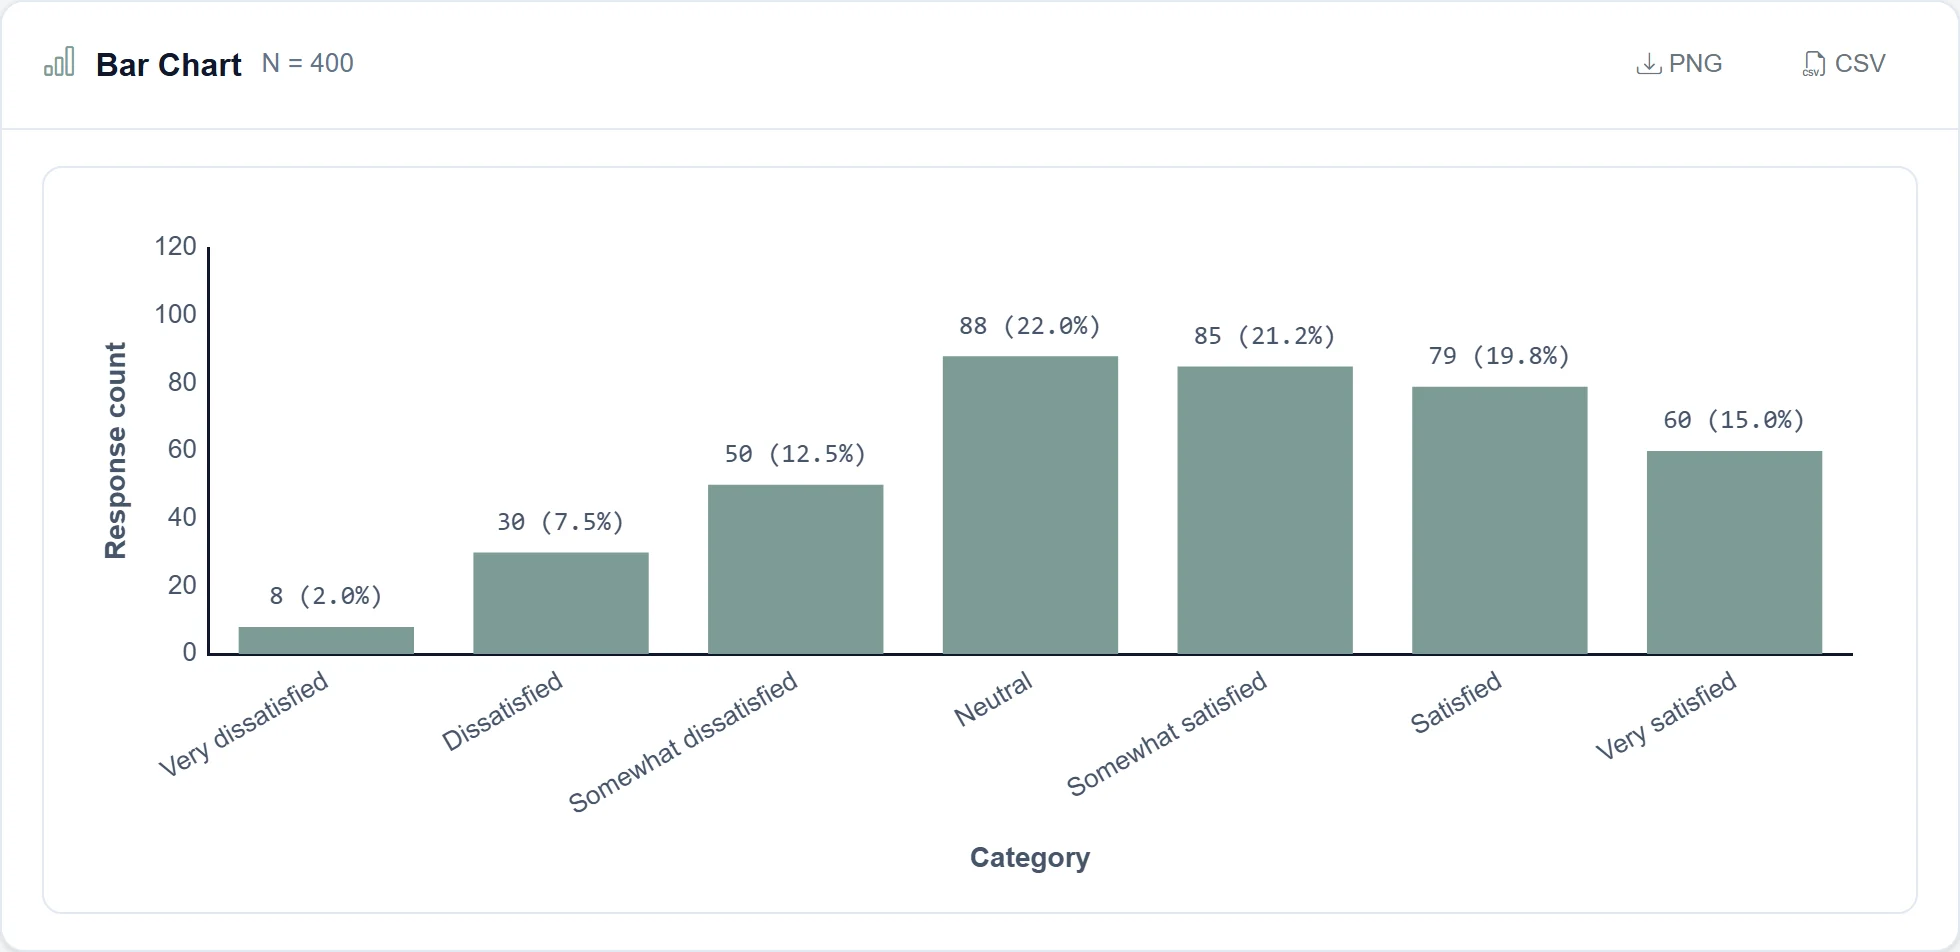
Frequencies
The distribution of answers to any question, with counts and percentages, as bars or a histogram.
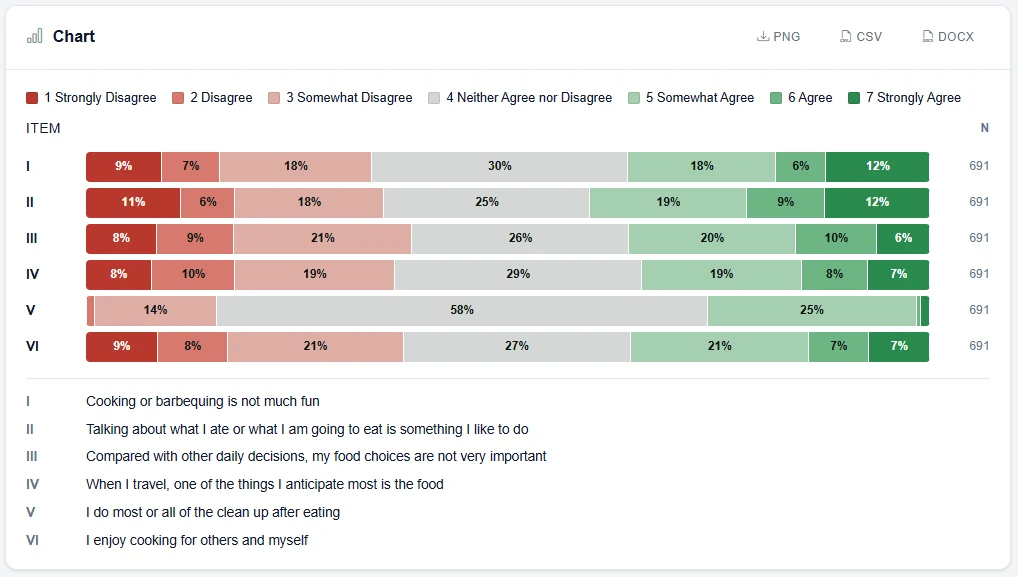
Stacked Bars
Several scale items side by side, one bar per item.
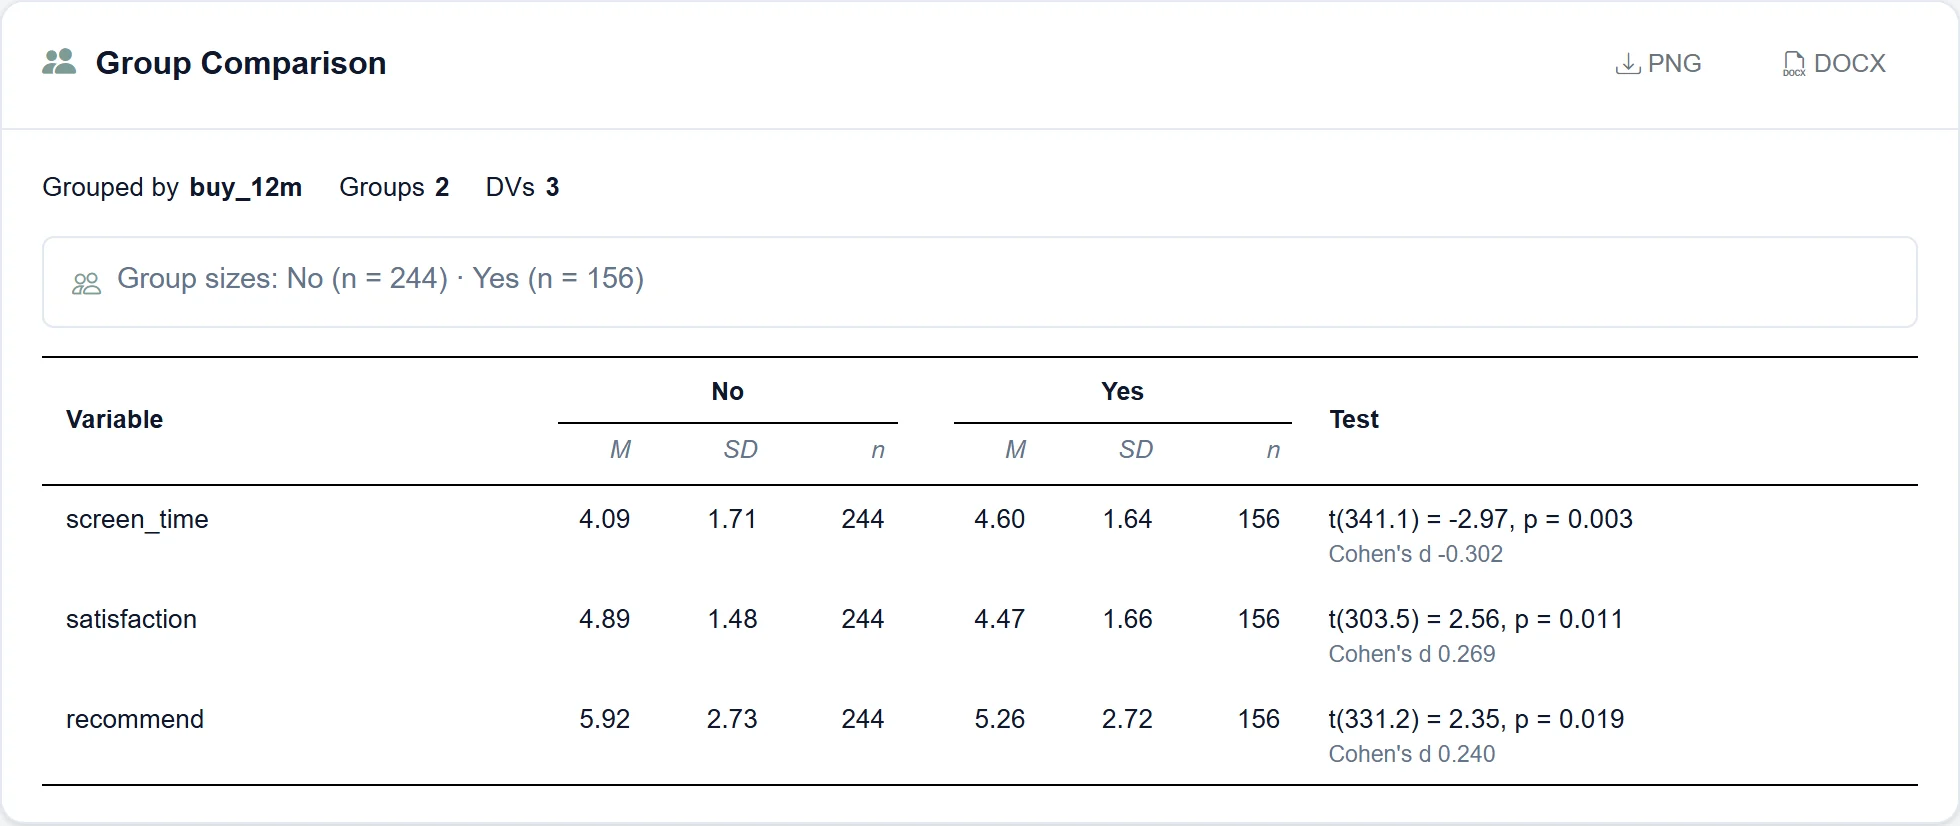
Compare Groups
Compare means across groups: a t-test for two groups, a one-way ANOVA for three or more, with effect sizes.
Crosstabs
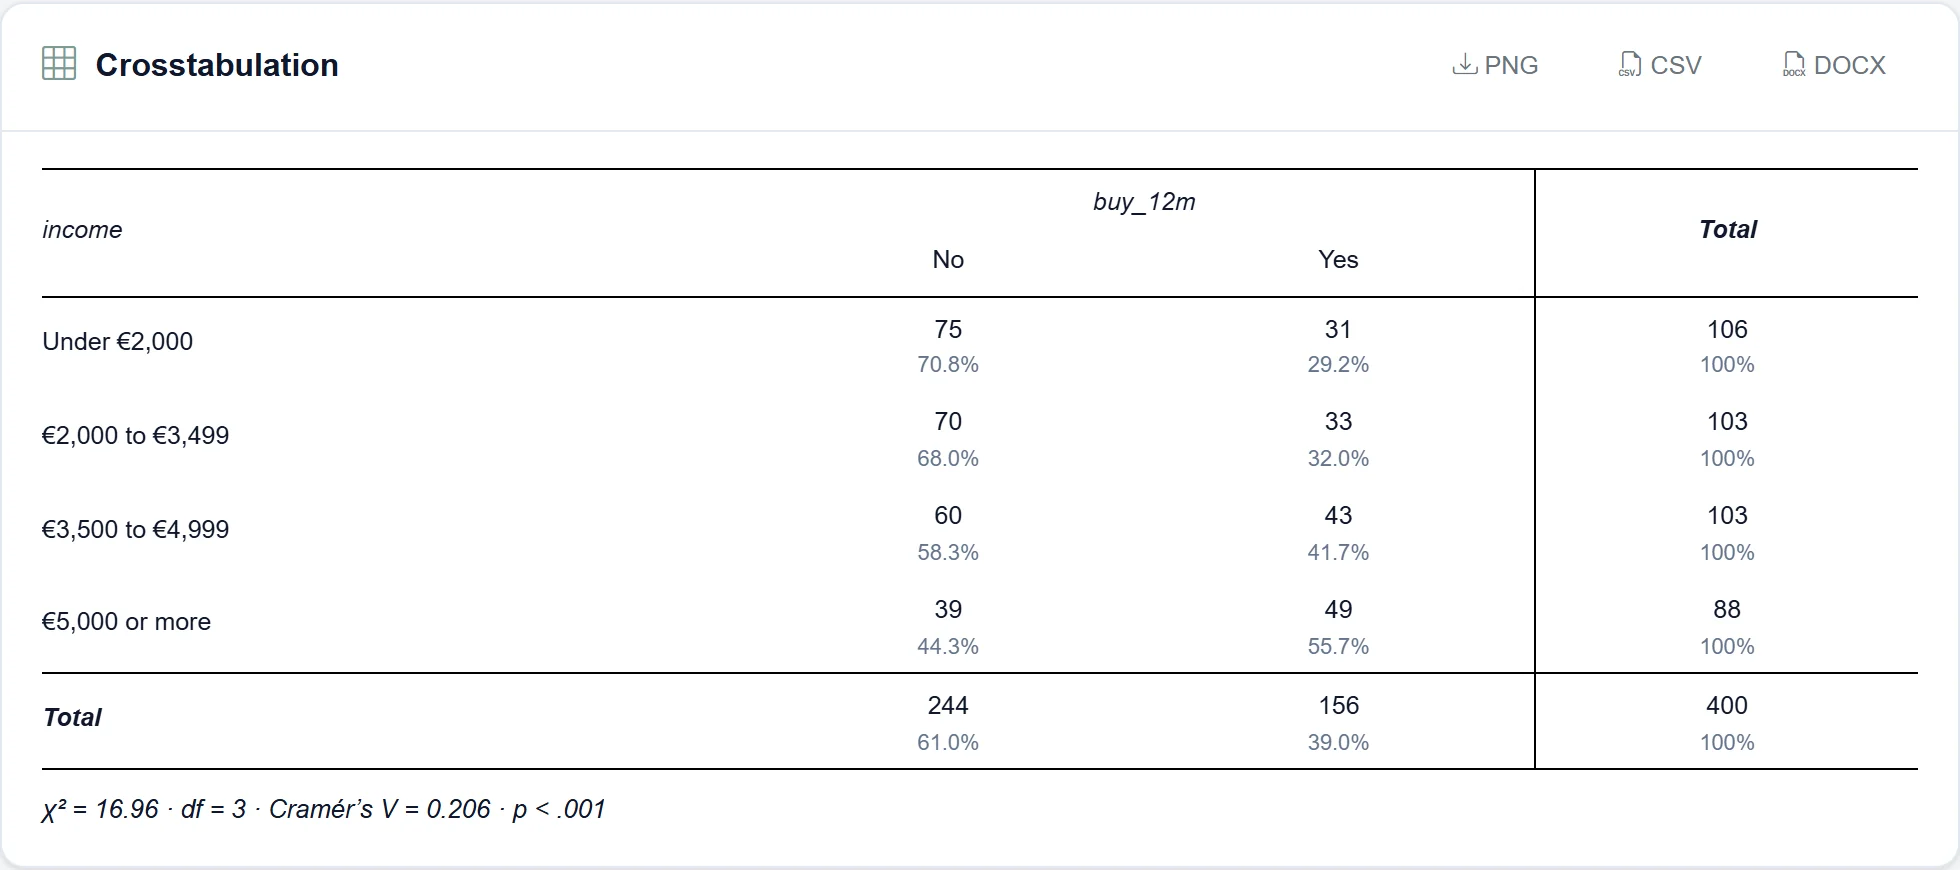
Cross-tabulate two questions with row or column percentages and a chi-square test of independence.
Correlations
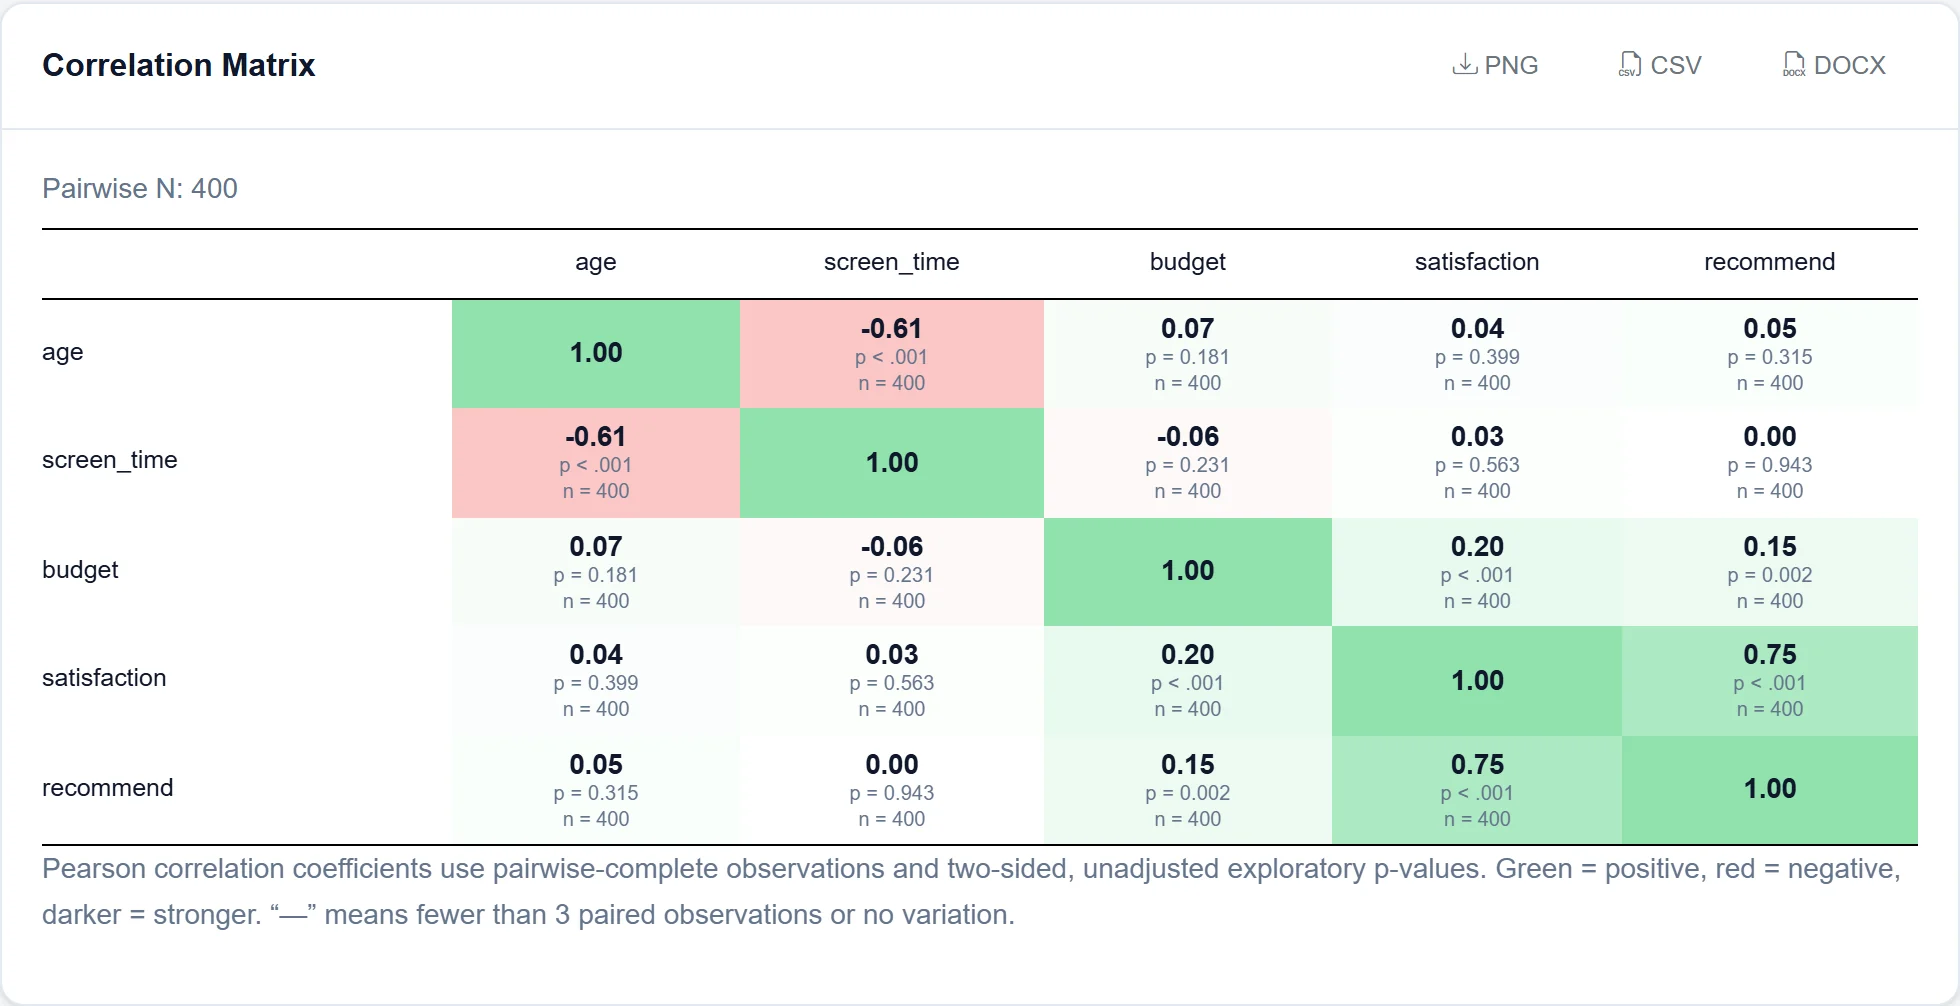
Pearson correlations between metric and ordinal variables in one matrix, with p-values and colour by strength.
Regressions
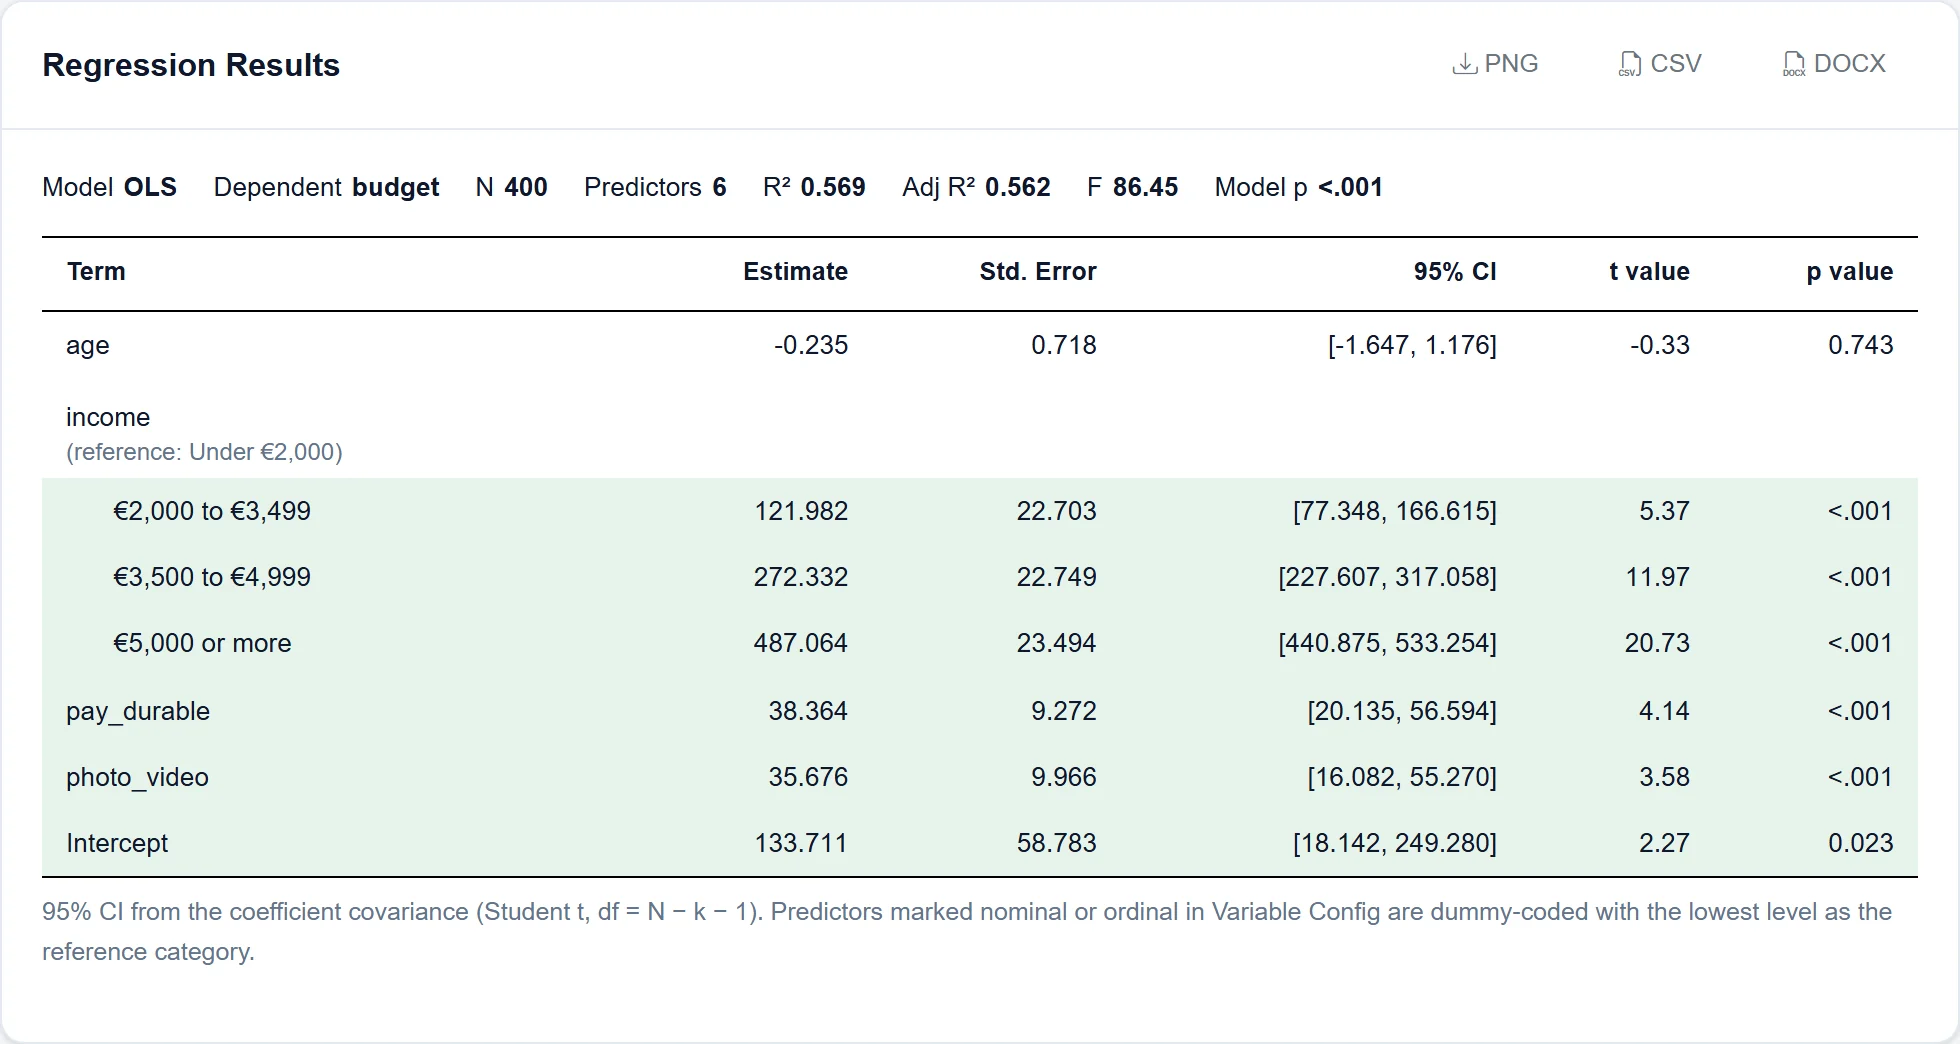
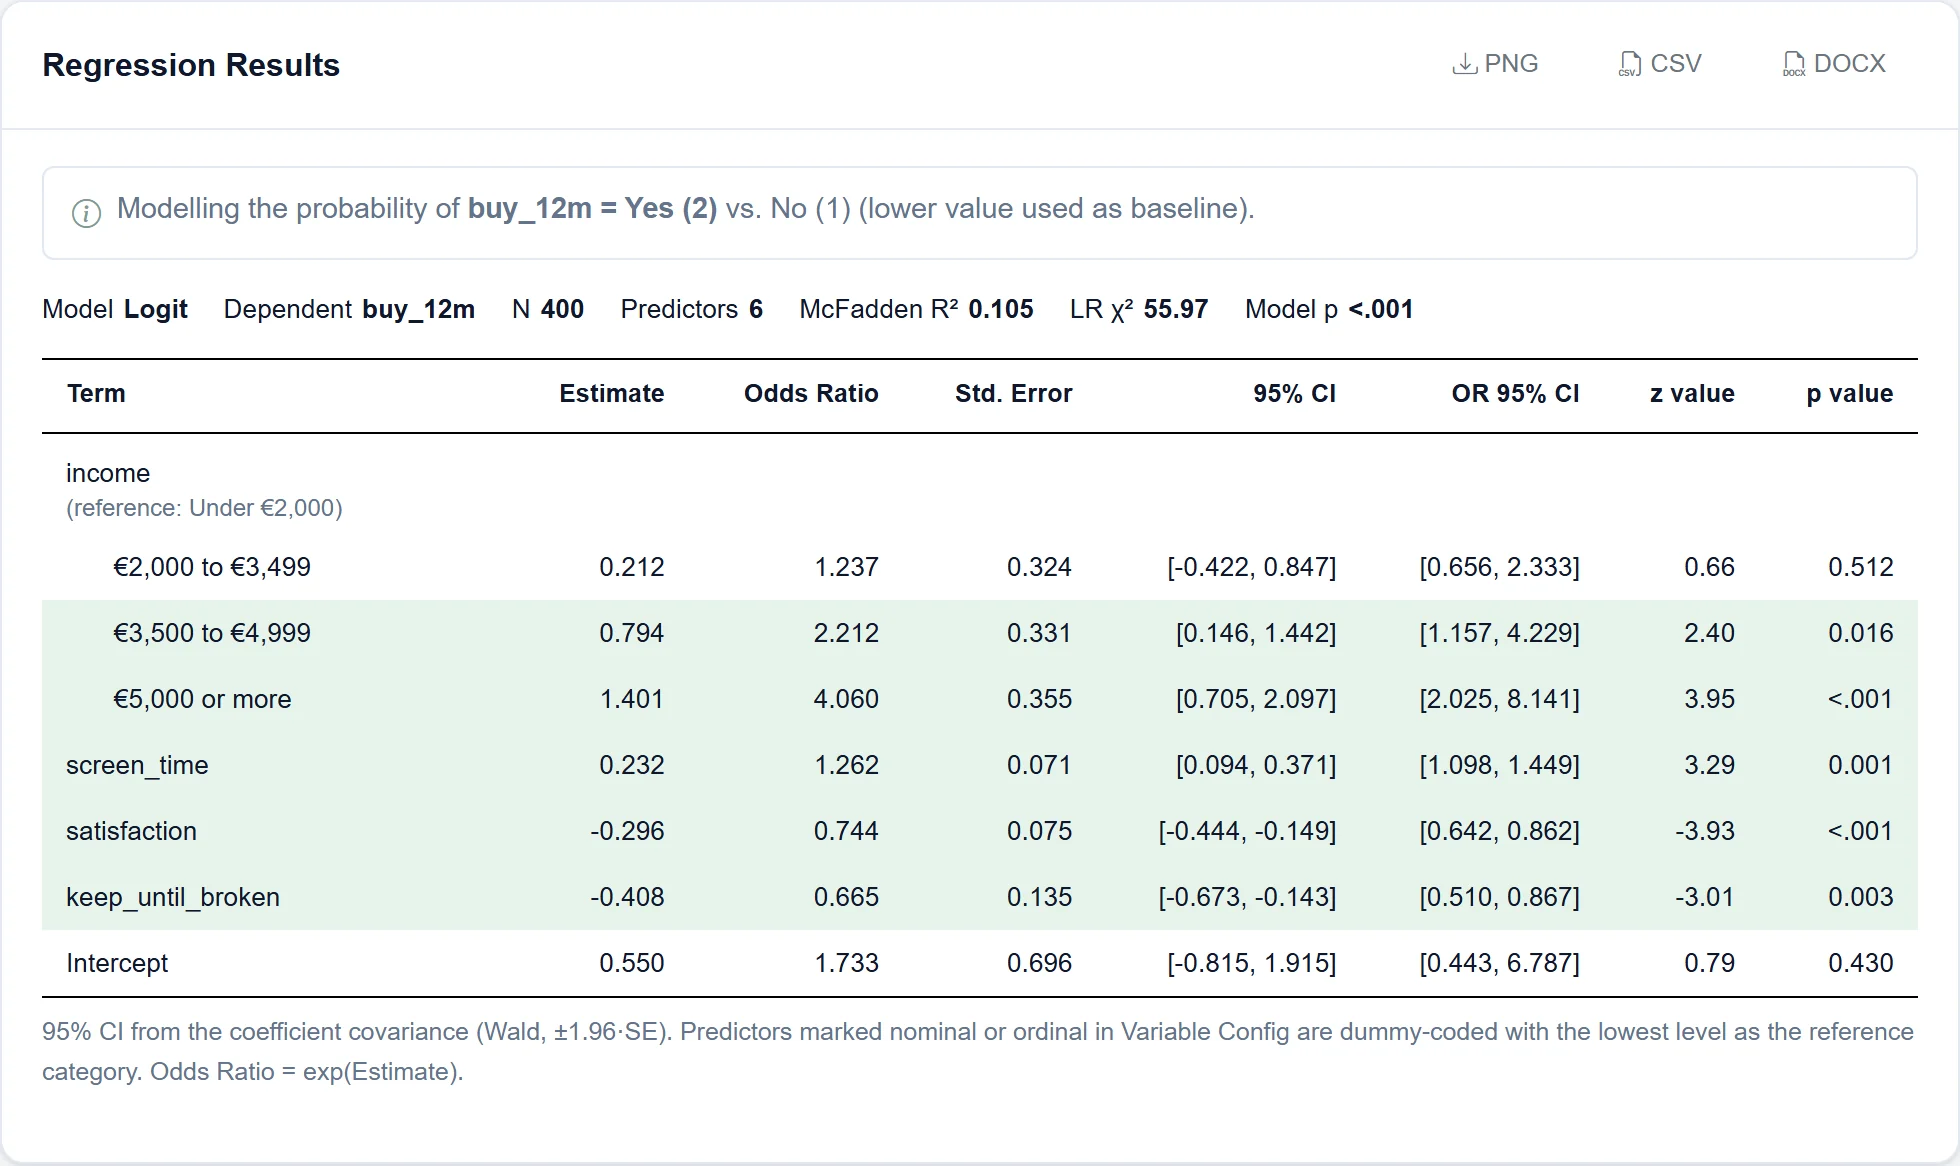
OLS for metric outcomes and logistic regression for yes/no outcomes. Nominal and ordinal predictors are dummy-coded.
Market Research
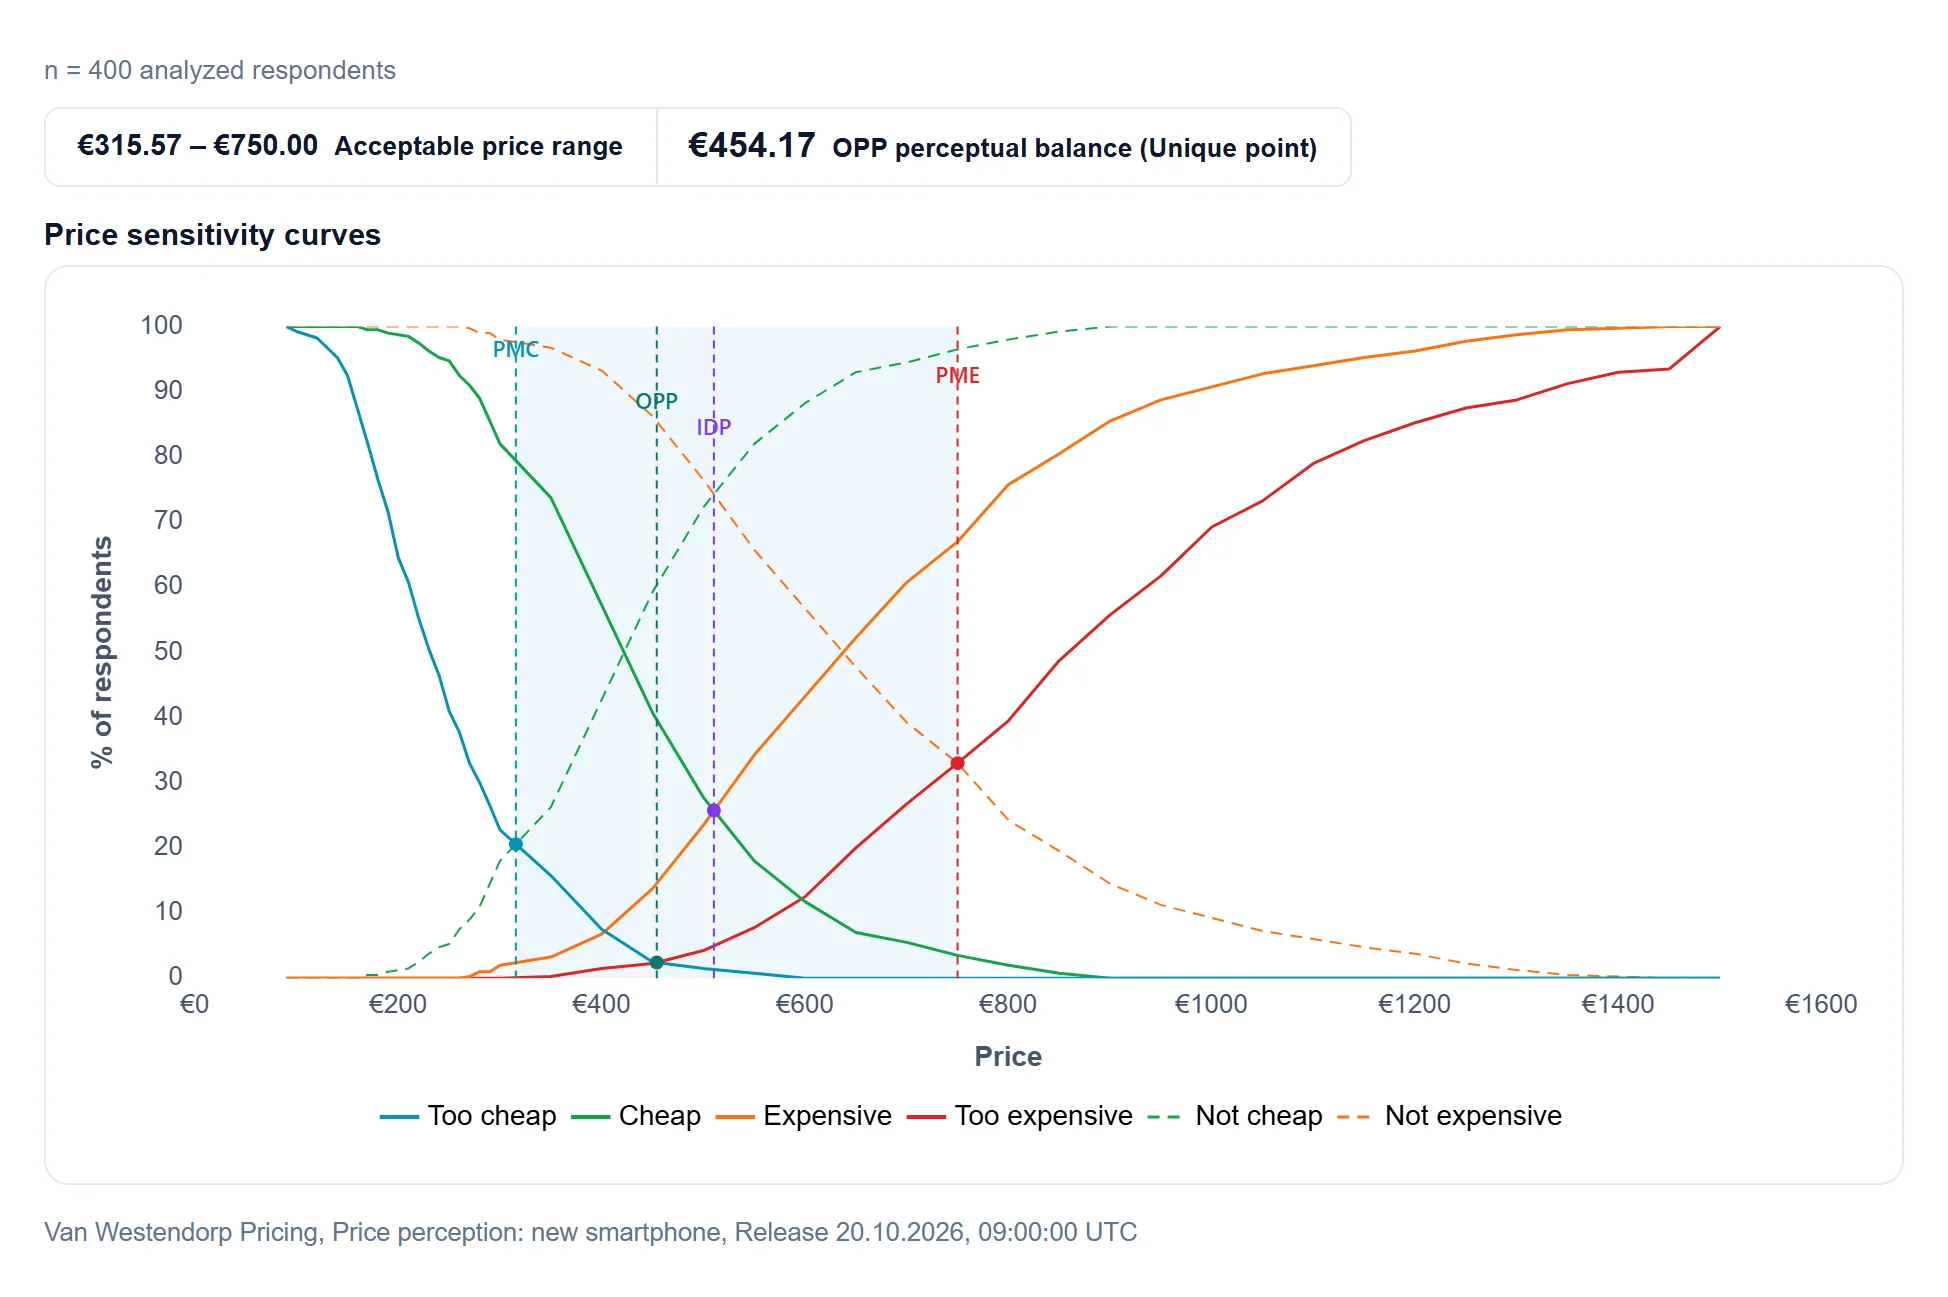
Van Westendorp, Gabor-Granger and Kano results from the pricing and feature questions of the study.
Importances
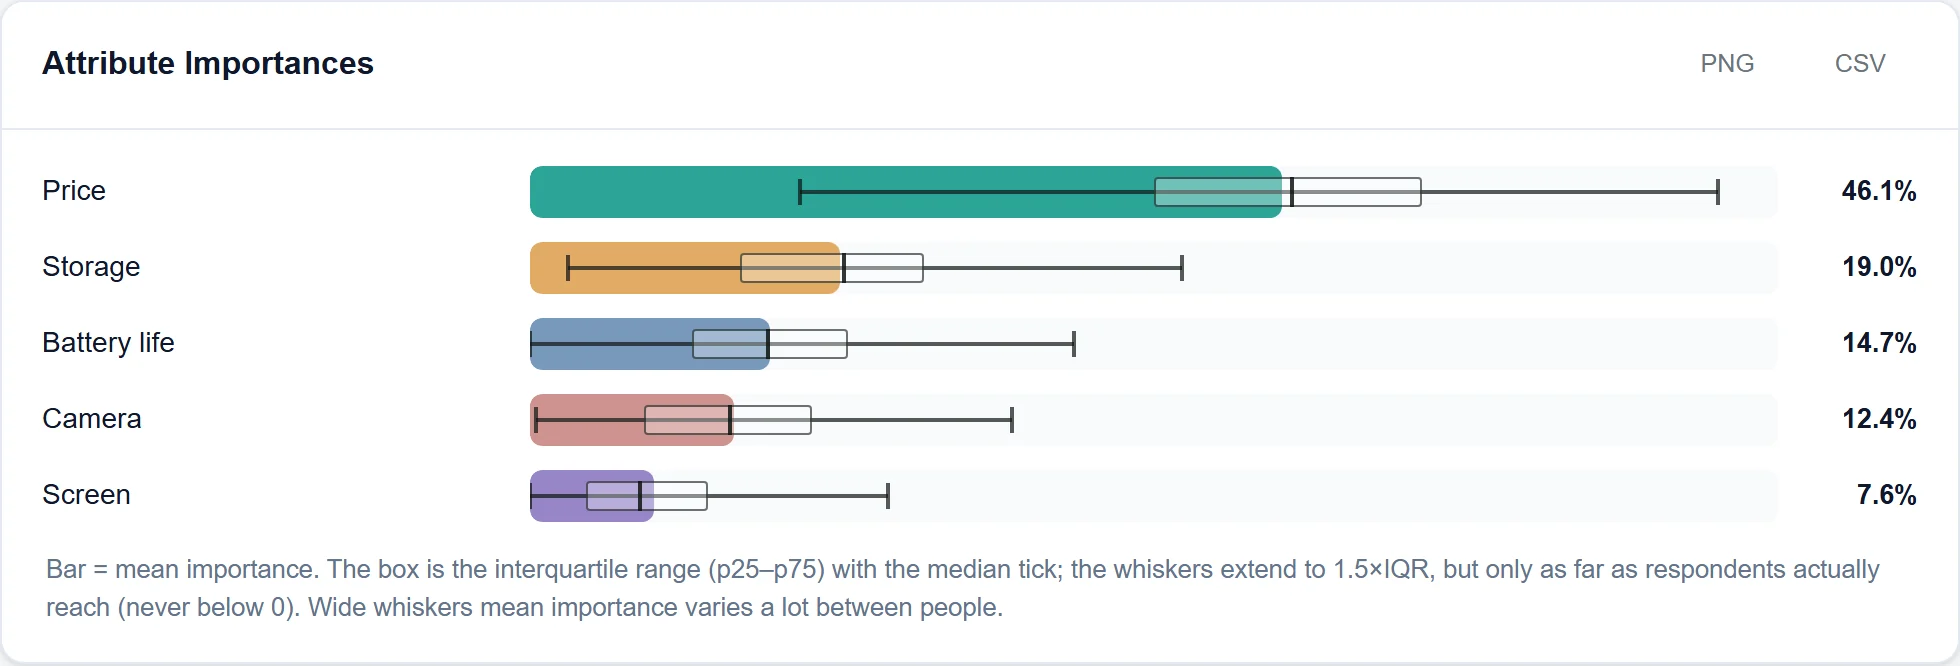
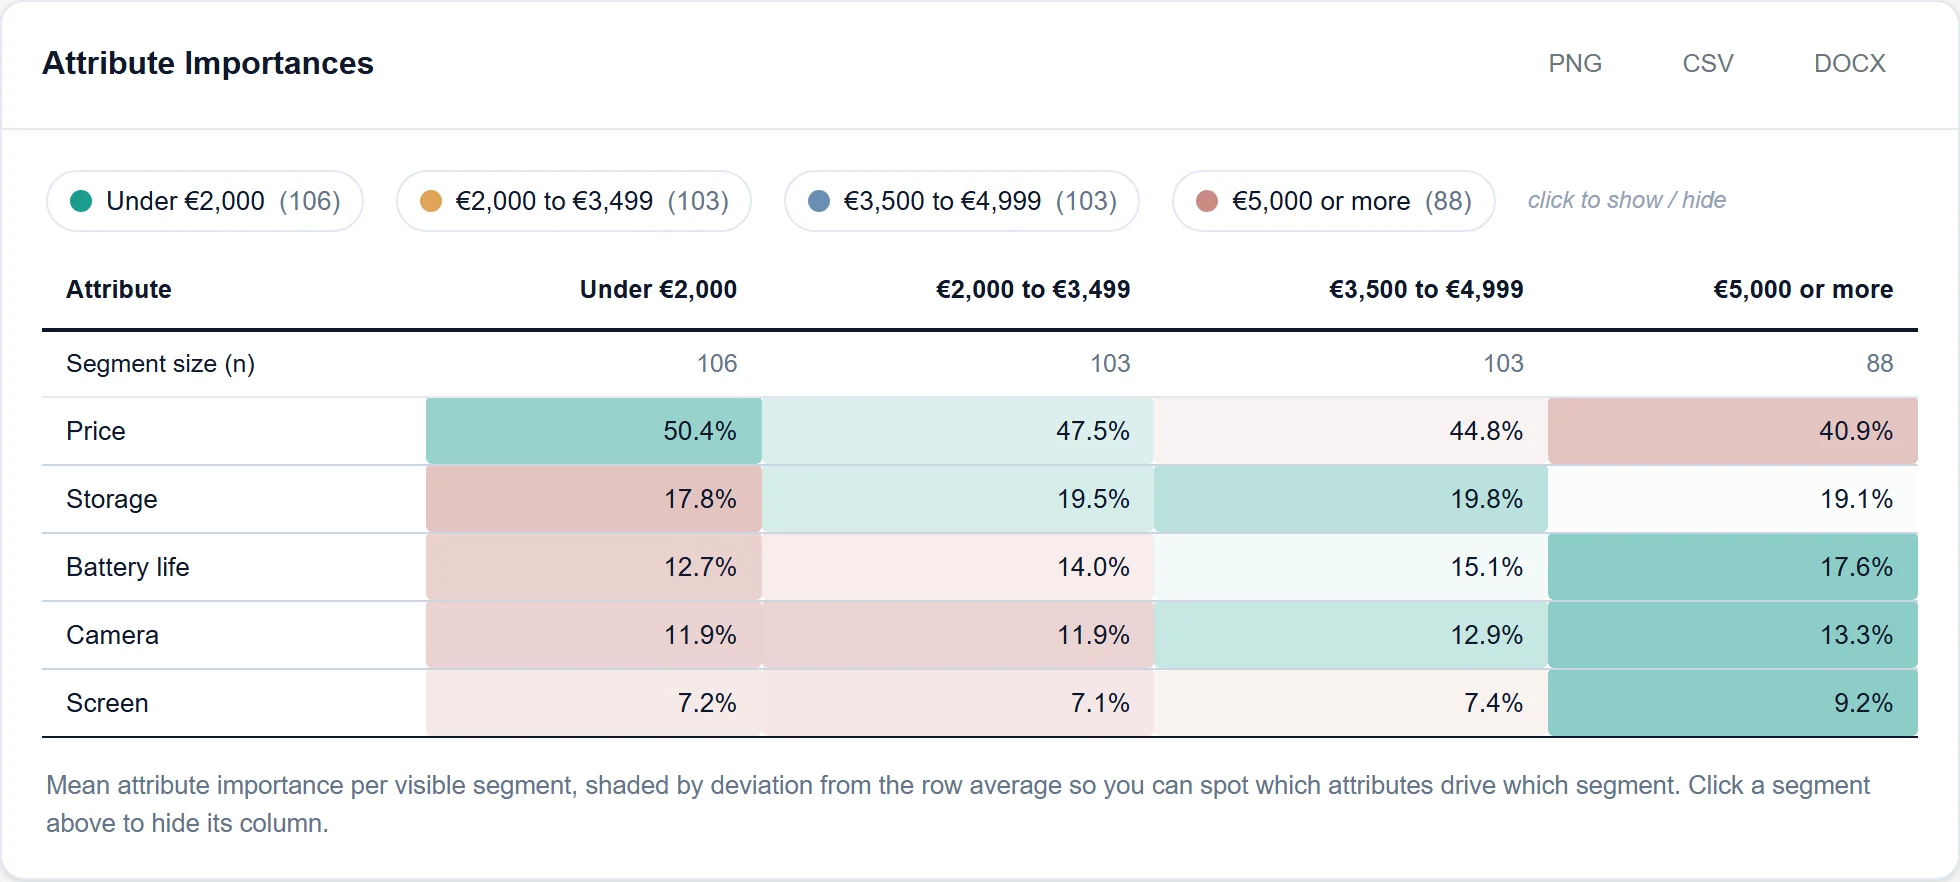
How much each conjoint attribute drives the choice, from every respondent’s HB utilities, for the whole sample or split by any question.
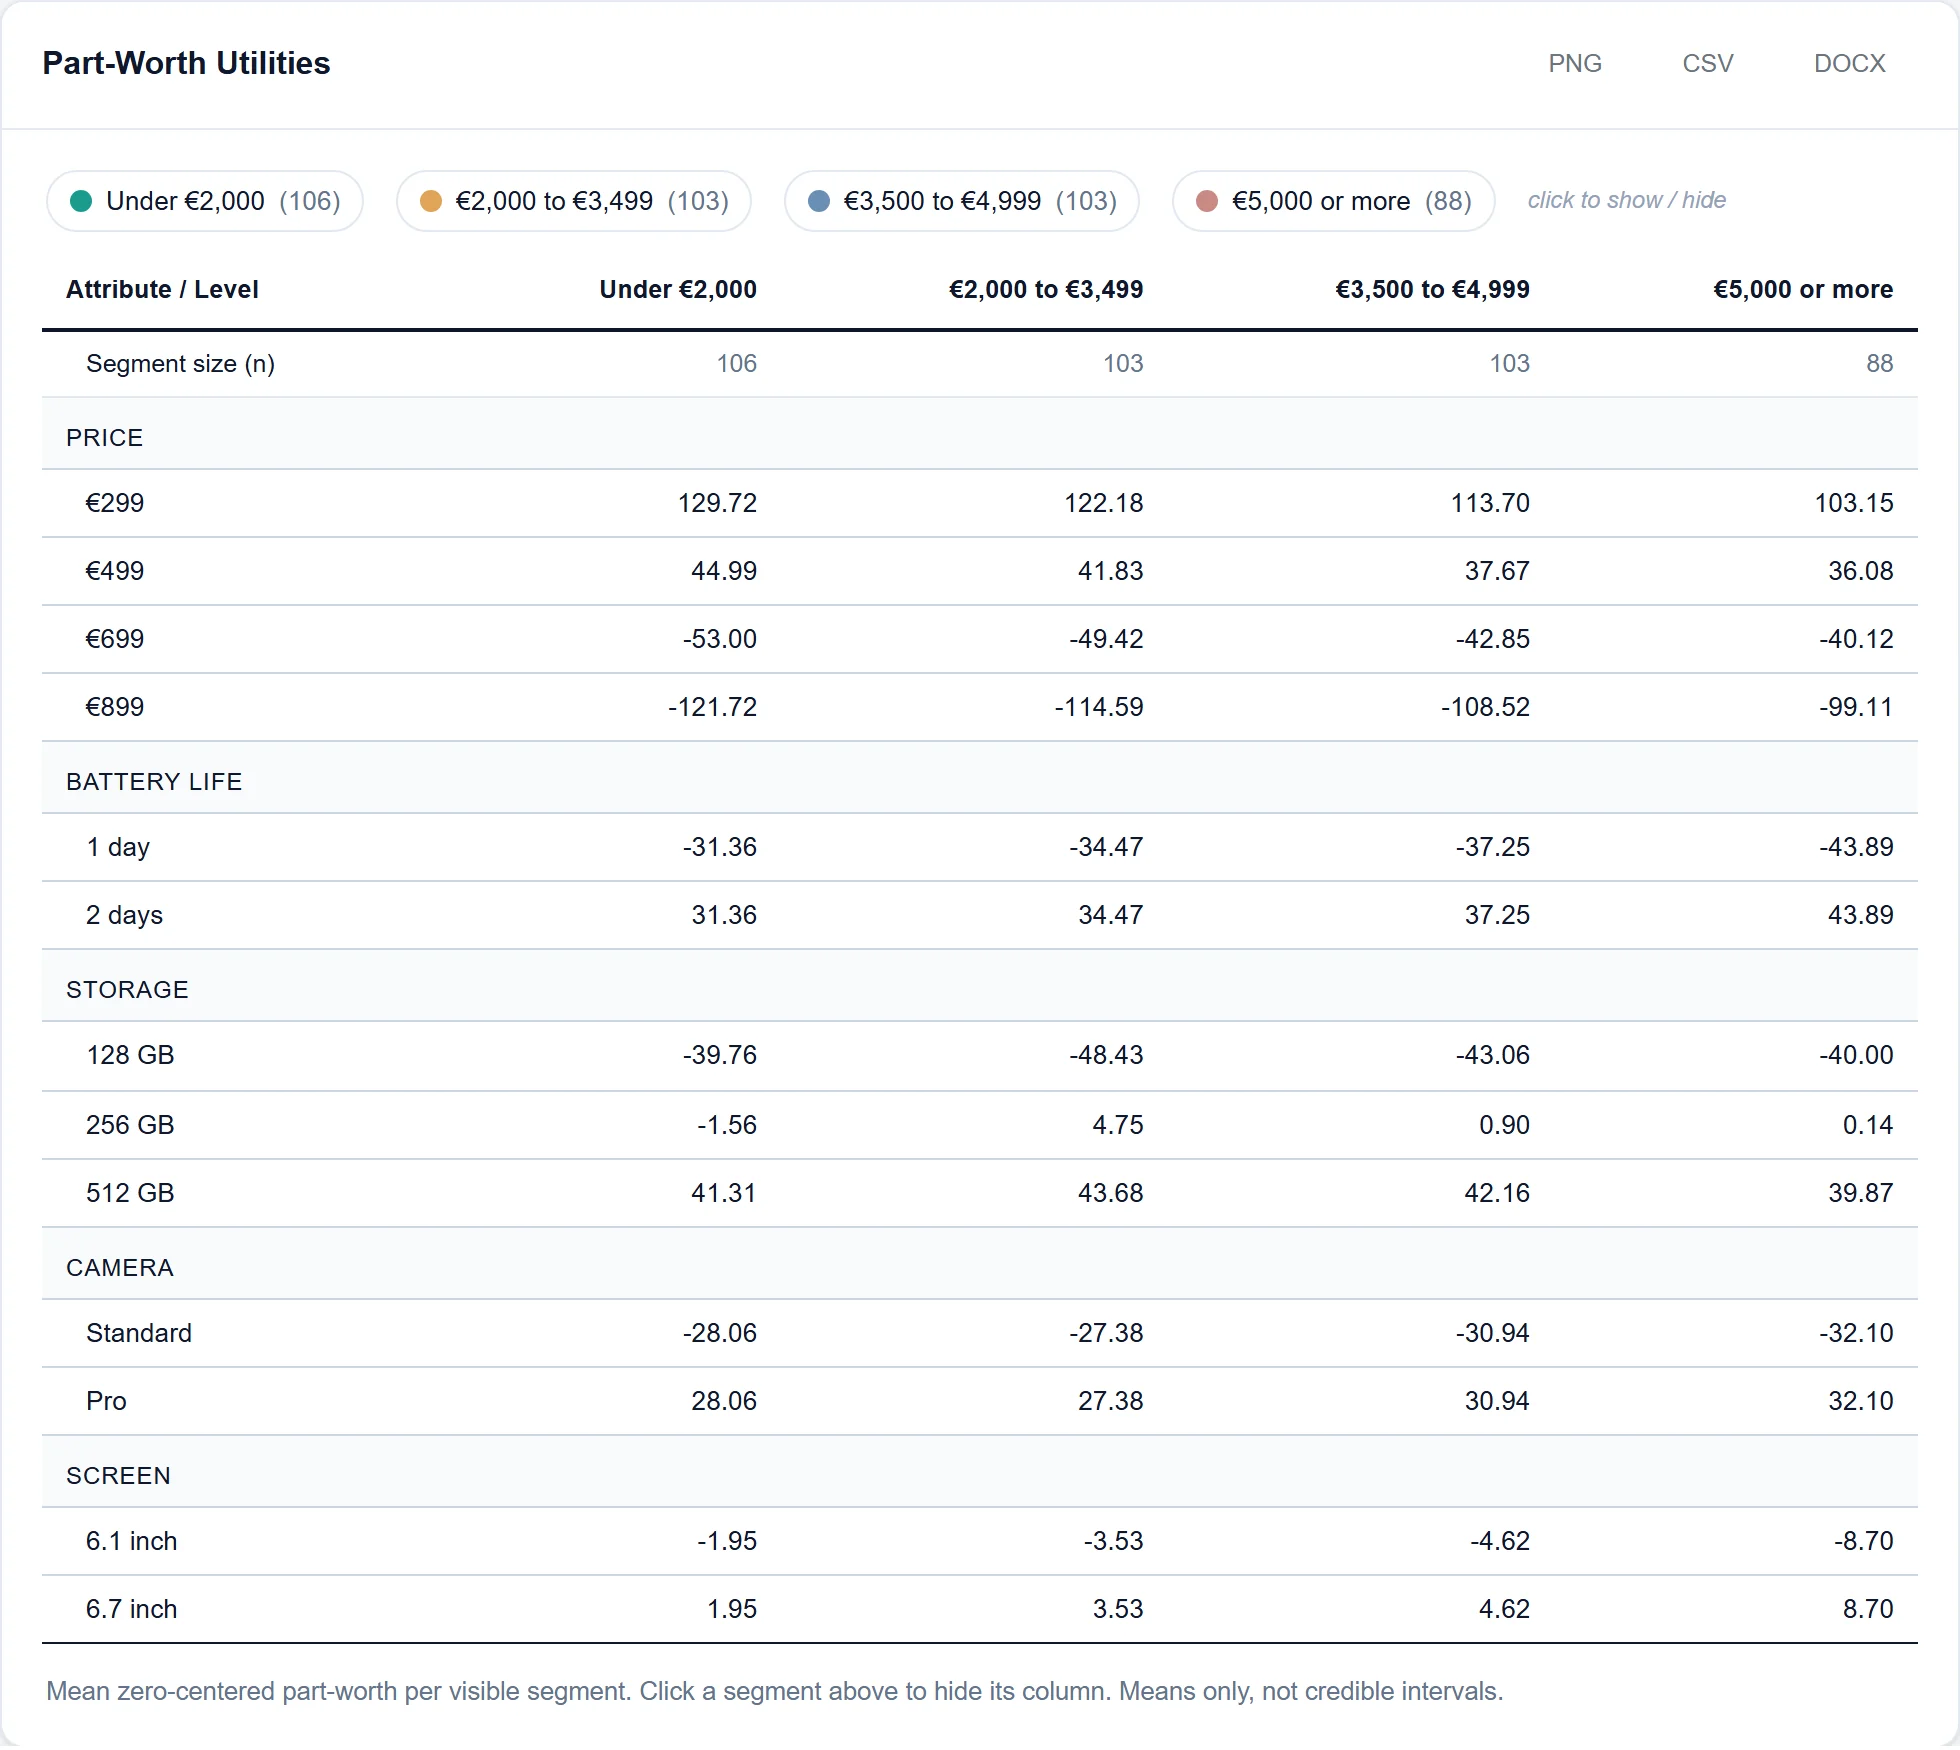
Part-Worth Utilities
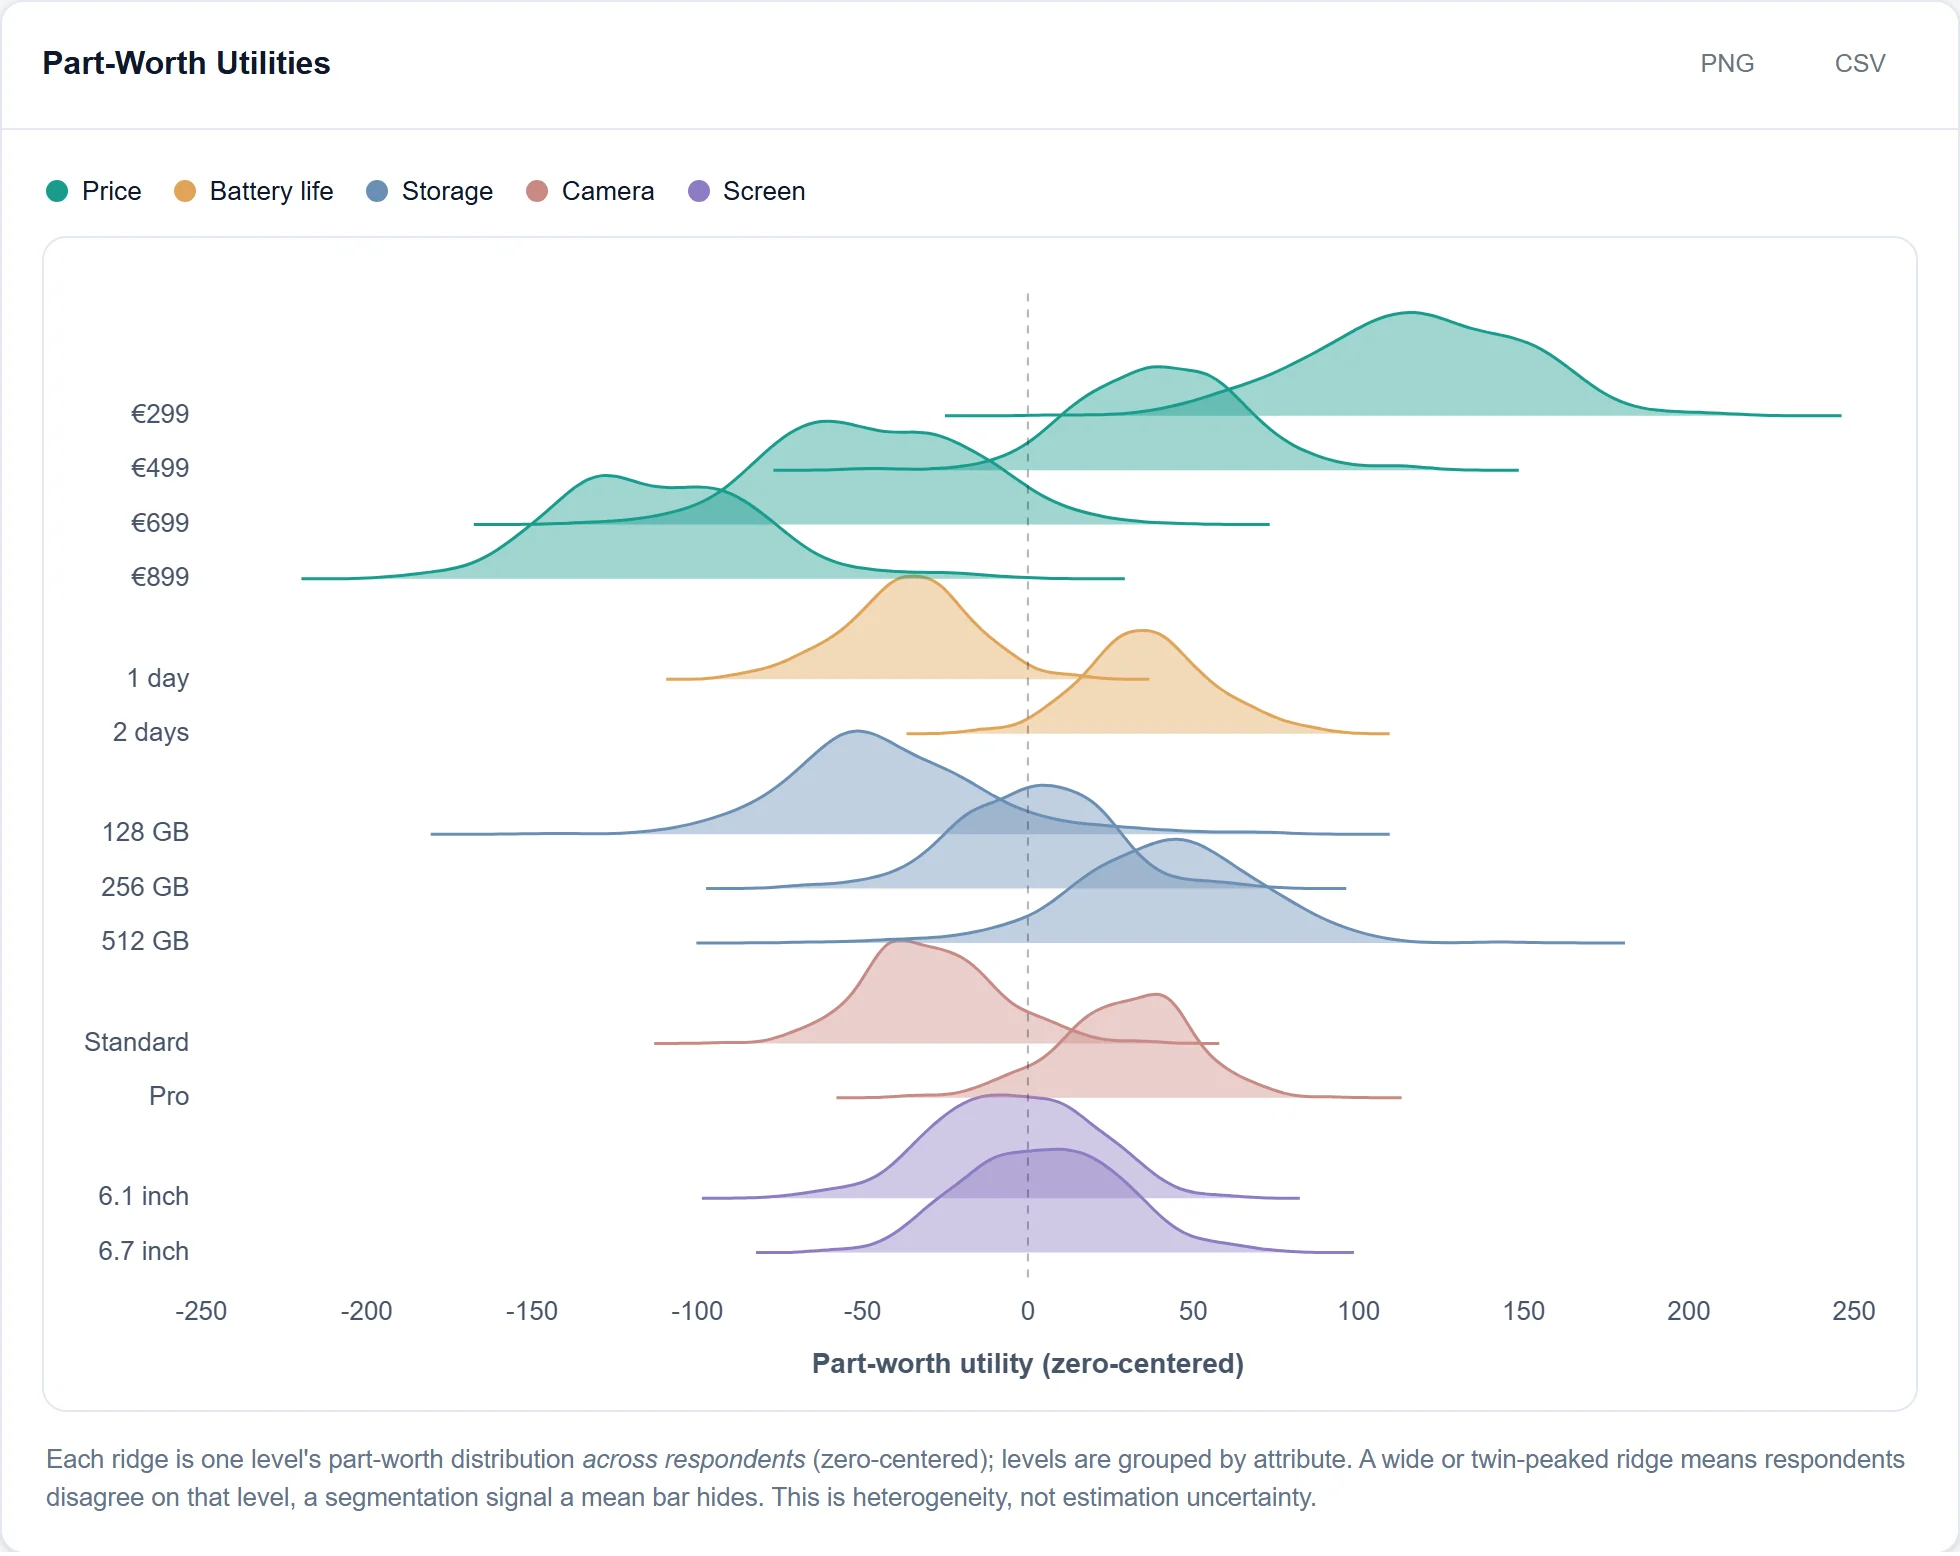
The value of every attribute level, as a distribution across respondents or as a table split by group.
Analyse the whole questionnaire
Choice data and every other question of the study in one project.