The manual of the CBC editor: every step and control, recommended study sizes from the literature, the design diagnostics, and how the choices become part-worth utilities. Worked example: the electric pizza oven CBC of the Pizza (Example) study.
How to build, field, and analyse a Choice-Based Conjoint study in Choicery, step by step through the editor.
1. What Is Traditional CBC?
Choice-Based Conjoint (CBC) shows respondents small sets of product profiles and asks one natural question:
which one would you choose? Each profile (concept) is a bundle of attribute levels. By repeating this
choice across many designed sets and many respondents, Choicery works out how much each level contributes to
choice. These contributions are the part-worth utilities.
A choice among alternatives mirrors what buyers do in a shop or on a website. Because respondents never state a
number, the method also avoids scale-use differences (some people rate everything high, others everything low).
The pizza oven CBC used throughout this guide
The Pizza (Example) study contains a CBC task cbc_pizza_oven about an electric pizza oven with five attributes: Maximum temperature (350 °C, 420 °C, 450 °C), Controls (Manual dial, Digital display with programmes, LED touch screen), Included accessories (Stone + pizza peel, Stone + pizza peel + recipe book, Pizza stone only), Customer rating (3.5 ★, 3.9 ★, 4.3 ★, 4.7 ★) and Price ($69, $139, $209, $279). Each task shows three ovens plus a "None of these" option.
What you get out of it
Individual part-worth utilities for every attribute level, one set per respondent.
Attribute importances: how much each attribute drives choice, as a percentage.
A simulator: define any set of products and predict their choice shares.
Downstream tools: willingness to pay, price elasticity, segmentation, and more.
2. When to Use It (and When Not)
Traditional CBC is the default when respondents choose one product from a handful of alternatives. It works best with a moderate number of attributes (see section 14).
Situation
Use
Standard "pick one of several products"
CBC Traditional
You also need "would you buy it at all?" after a forced choice
DR-CBC (dual response)
You want extra information per task (best and worst)
Best-Worst CBC
A realistic shop, shelf or e-commerce presentation matters
CBC Shop
Many single items (features, messages), no product profiles
MaxDiff
All of these share the same statistical engine. They differ in what the respondent does in each task and in how the answers are stacked before estimation. Each has its own guide.
3. Opening the Editor
From the Survey Flow
1
New task. In the Survey Flow, open the Add Item sidebar (on wide screens it is always visible; on smaller screens use the Add Item button in the utility bar) and choose CBC Traditional in the Conjoint section. The editor opens with a new, empty task.
2
Existing task. On the task's card in the flow, click Edit (tooltip "Configure"). In the list view, click the row or its gear link.
The browser tab reads "CBC Design Configuration", and the left rail carries the badge "CBC Traditional". On a Free account a project can hold at most two conjoint tasks.
CBC Guide: opens this guide in a new browser tab, so unsaved edits in the editor stay where they are.
Table 1. The steps of the CBC editor. The sections below follow this order.
What saves automatically and what needs a click
Step
How changes are stored
General
Click Save changes in the toolbar at the top of the step. The status next to it reads "Saved" once everything is stored.
Attributes
Adding, editing, deleting, hiding and reordering attributes are stored at once.
No-Choice Option
Its own button Save no-choice options.
Fixed Tasks, Product Images, Prohibitions
Stored when you confirm the dialog (Save Fixed Task, Add Rule, Add). Fixed-task positions need Apply Positions on the Generate step.
Level Images
Stored when you pick or remove an image.
Templates
Click Save or Apply.
Generate
The generated design is stored as soon as generation finishes.
Table 2. Saving in the CBC editor.
The two locks
The design and the answers must stay aligned, so the editor locks structure in two stages.
A design exists. The Attributes step shows "Attributes are locked. Delete the generated design before changing attributes or levels. Your existing configuration will be kept." with the button Delete generated design to edit attributes. Prohibitions are locked in the same way. Everything else (question, display, images, fixed-task definitions) stays editable.
Responses exist. A banner at the top of every step reads "Design locked - responses already collected" with the number of active and trashed responses that reference the design. It explains that changing the design would mis-align every recorded answer, and that you must open Data > Bin and permanently delete all responses first, or duplicate the project to keep them. Preview, downloads and design diagnostics stay available. The attribute notice then says the design cannot be deleted until all related responses are permanently deleted.
Above all steps the editor can also show "Design Warning: ..." when the stored design no longer matches the configuration, and "Regeneration required. This generated design conflicts with active prohibitions and cannot be published until it is regenerated."
4. General
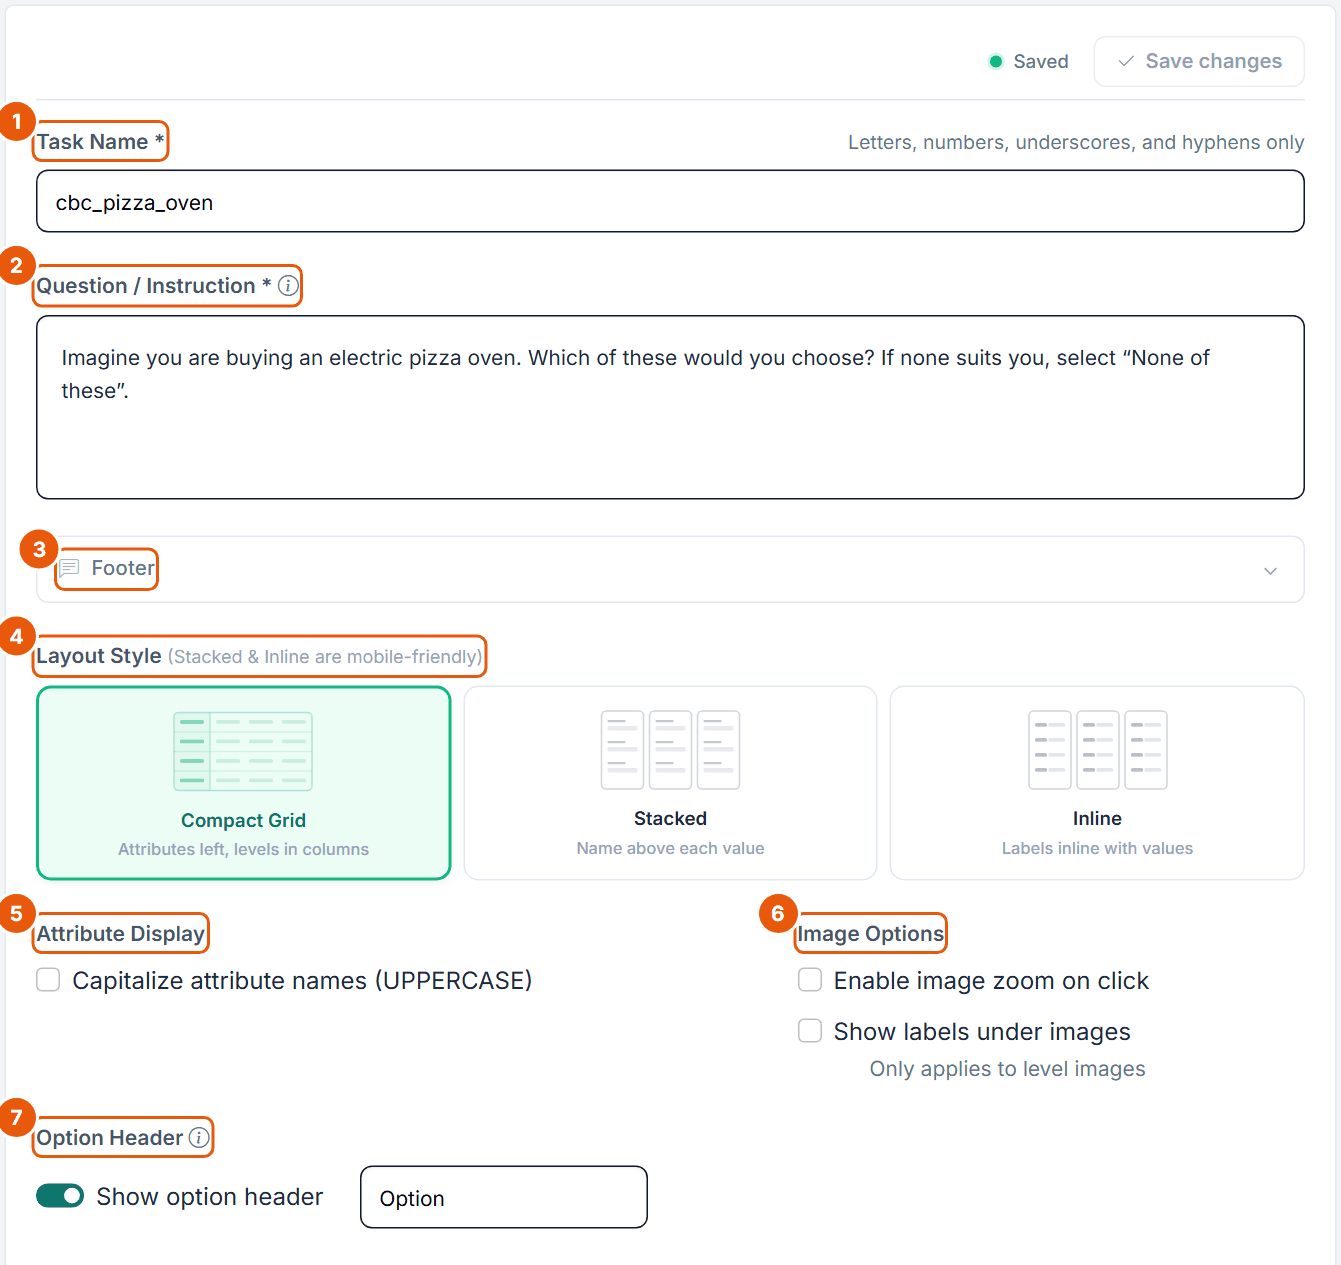
The General step holds the task name, the question and the display settings of the choice task.
Figure 1. The General step of the pizza oven task.
No.
Control
What it does
1
Task Name *
Internal name of the task and the column prefix in your data (cbc_pizza_oven in the example). Up to 50 characters, start with a letter, then letters, numbers, underscores and hyphens.
2
Question / Instruction *
Rich text shown above every choice task. The default reads "If you were buying a new product and these were the only alternatives available, which one would you choose?". Up to 10,000 characters and 10 inline images.
3
Footer
Optional rich text below the task, for example a note on delivery terms. Up to 10,000 characters.
4
Layout Style
How the concepts are drawn: Compact Grid (attributes left, levels in columns), Stacked (name above each value) or Inline (labels inline with values, the default for a new task). Stacked and Inline work better on phones. The Pizza task uses Compact Grid.
5
Attribute Display
Capitalize attribute names (UPPERCASE), off by default.
6
Image Options
Enable image zoom on click lets respondents enlarge images. Show labels under images prints the level text under a level image (only applies to level images). Both off by default.
7
Option Header
Show option header (on by default) prints a label above each concept, such as "Option 1", "Option 2". The text field sets the word ("Option" by default, up to 100 characters) and is disabled while the switch is off.
Click Save changes at the top right when you are done.
5. Attributes and the No-Choice Option
Attributes
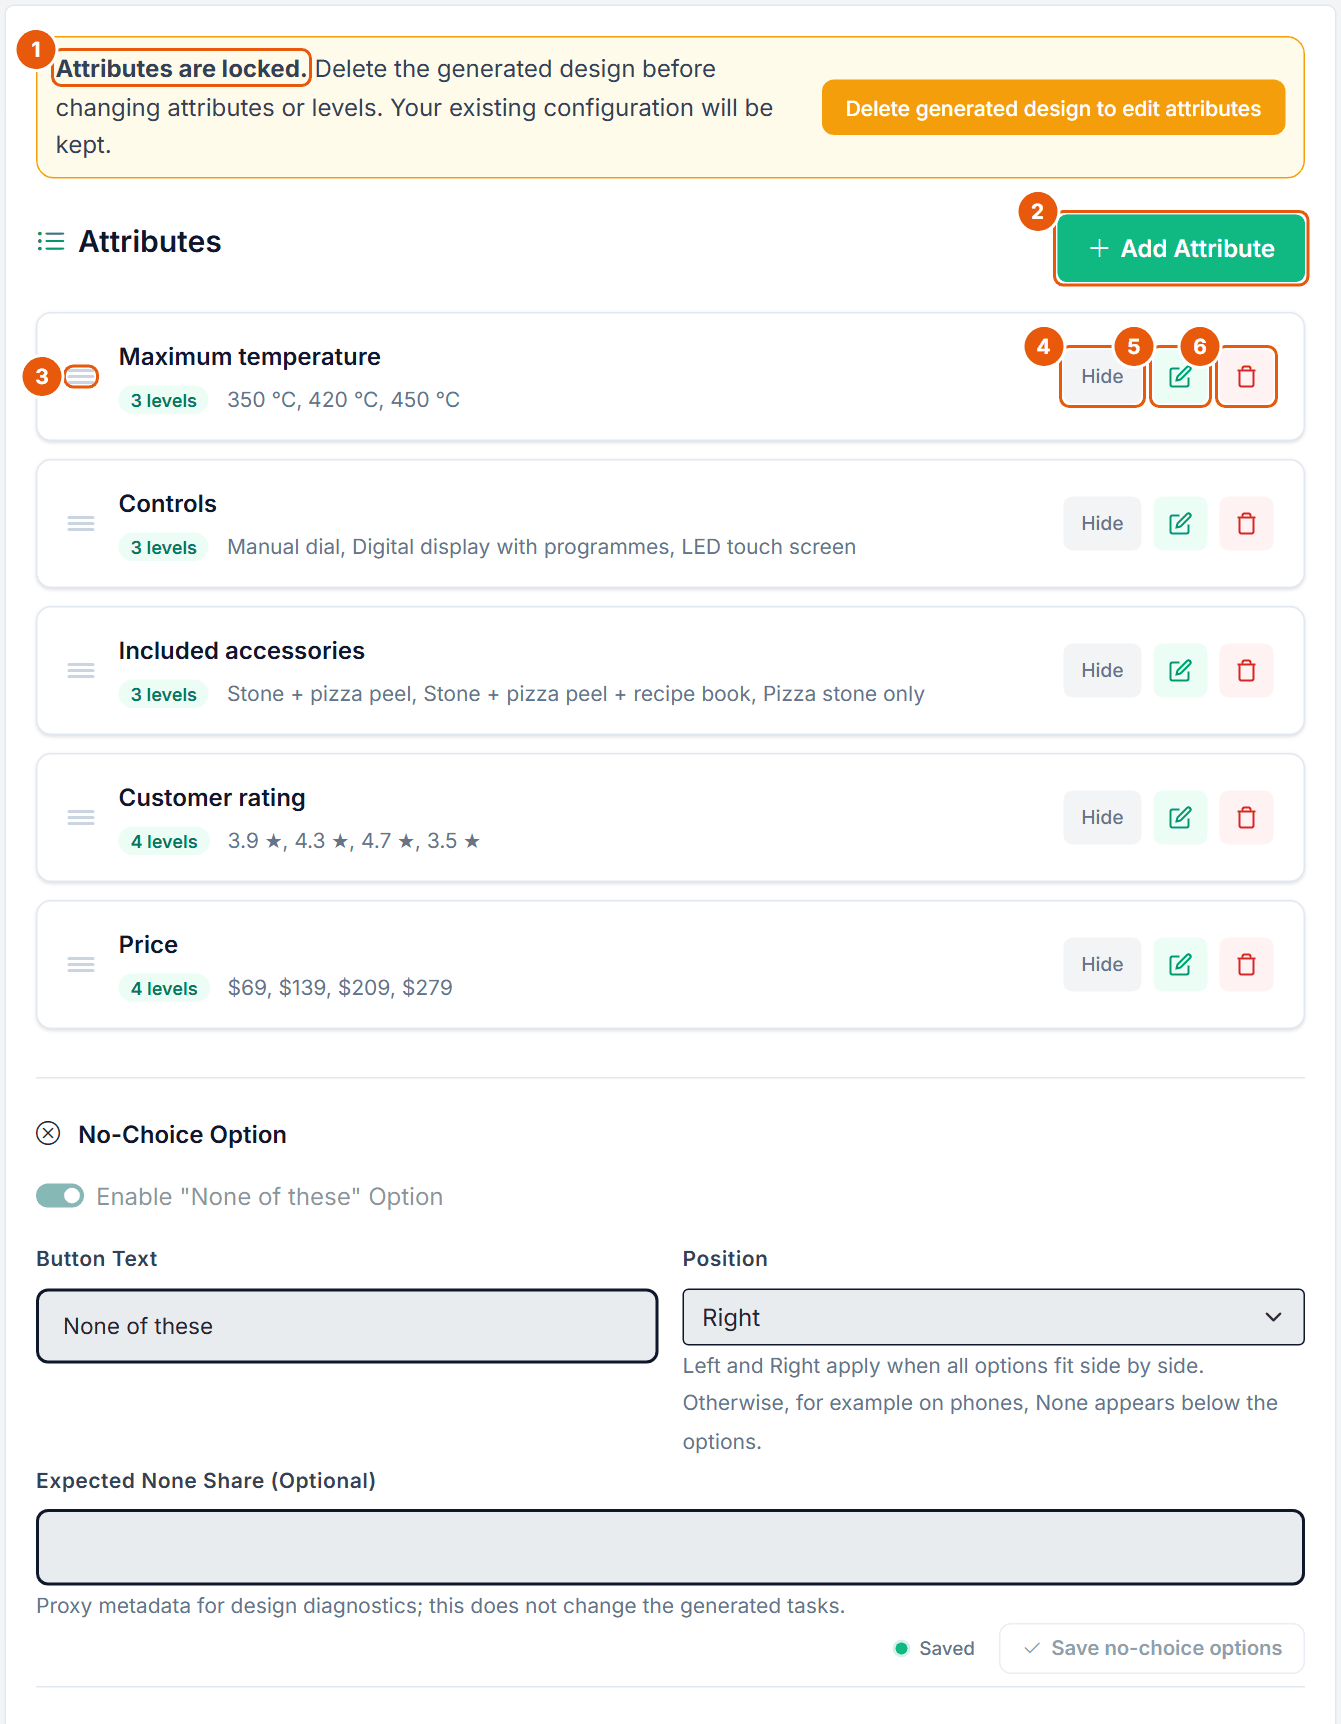
Figure 2. The Attributes step of the pizza oven task. The design is generated, so the attributes are locked.
No.
Control
What it does
1
Attributes are locked.
Shown while a generated design exists (section 3). The orange button deletes the design so you can edit attributes again; all other settings are kept.
2
Add Attribute
Opens the Add Attribute dialog (Figure 3).
3
Drag handle
Drag a card to change the order of the attributes in the task.
4
Hide / Show
Hidden attributes stay part of the design and are still estimated, but they are not displayed in the survey. The card then carries a "Hidden" badge. Use it when an image already shows the attribute.
5
Edit
Opens the Edit Attribute dialog. Here the name and each level are small rich-text editors (without images), levels can be reordered, and Shift+Enter adds a line break inside a level. Confirm with Save changes.
6
Delete
Deletes the attribute after the confirmation "Delete attribute "<name>"? This cannot be undone."
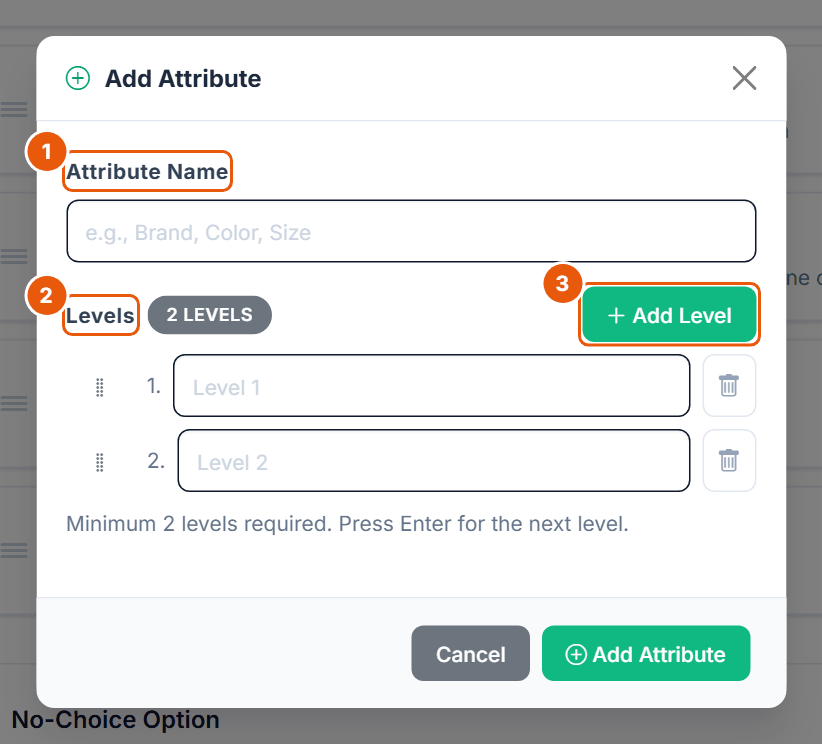
Figure 3. The Add Attribute dialog.
No.
Control
What it does
1
Attribute Name
For example "Maximum temperature". Up to 50 characters.
2
Levels
One row per level, with a badge counting them. Drag the dotted handle to reorder, use the bin to delete a row. Up to 50 characters per level. Press Enter in a level to jump to the next one.
3
Add Level
Adds an empty level row. At least 2 levels are required ("Please provide an attribute name and at least 2 levels").
Rules the server checks when you save:
Each attribute has 2 to 20 levels; a task has at most 20 attributes. These are technical limits. Section 14 explains why far fewer is better.
Attribute names must be unique, ignoring capitalization ("Attribute names 'X' and 'Y' are duplicates (ignoring capitalization)."). The same holds for the levels of one attribute.
Free plan: at most 4 attributes with at most 4 levels each. A meter "N of 4 attributes" shows the use; at the cap, Add Attribute opens the upgrade dialog. The Pizza task, with five attributes, needs a paid plan.
A dialog may warn "Review attribute-level formatting: ..." when levels look inconsistently formatted, for example mixed units.
No-Choice Option
Below the attribute cards sits the No-Choice Option. When it is on, every task gets an extra "None of these" choice next to the concepts.
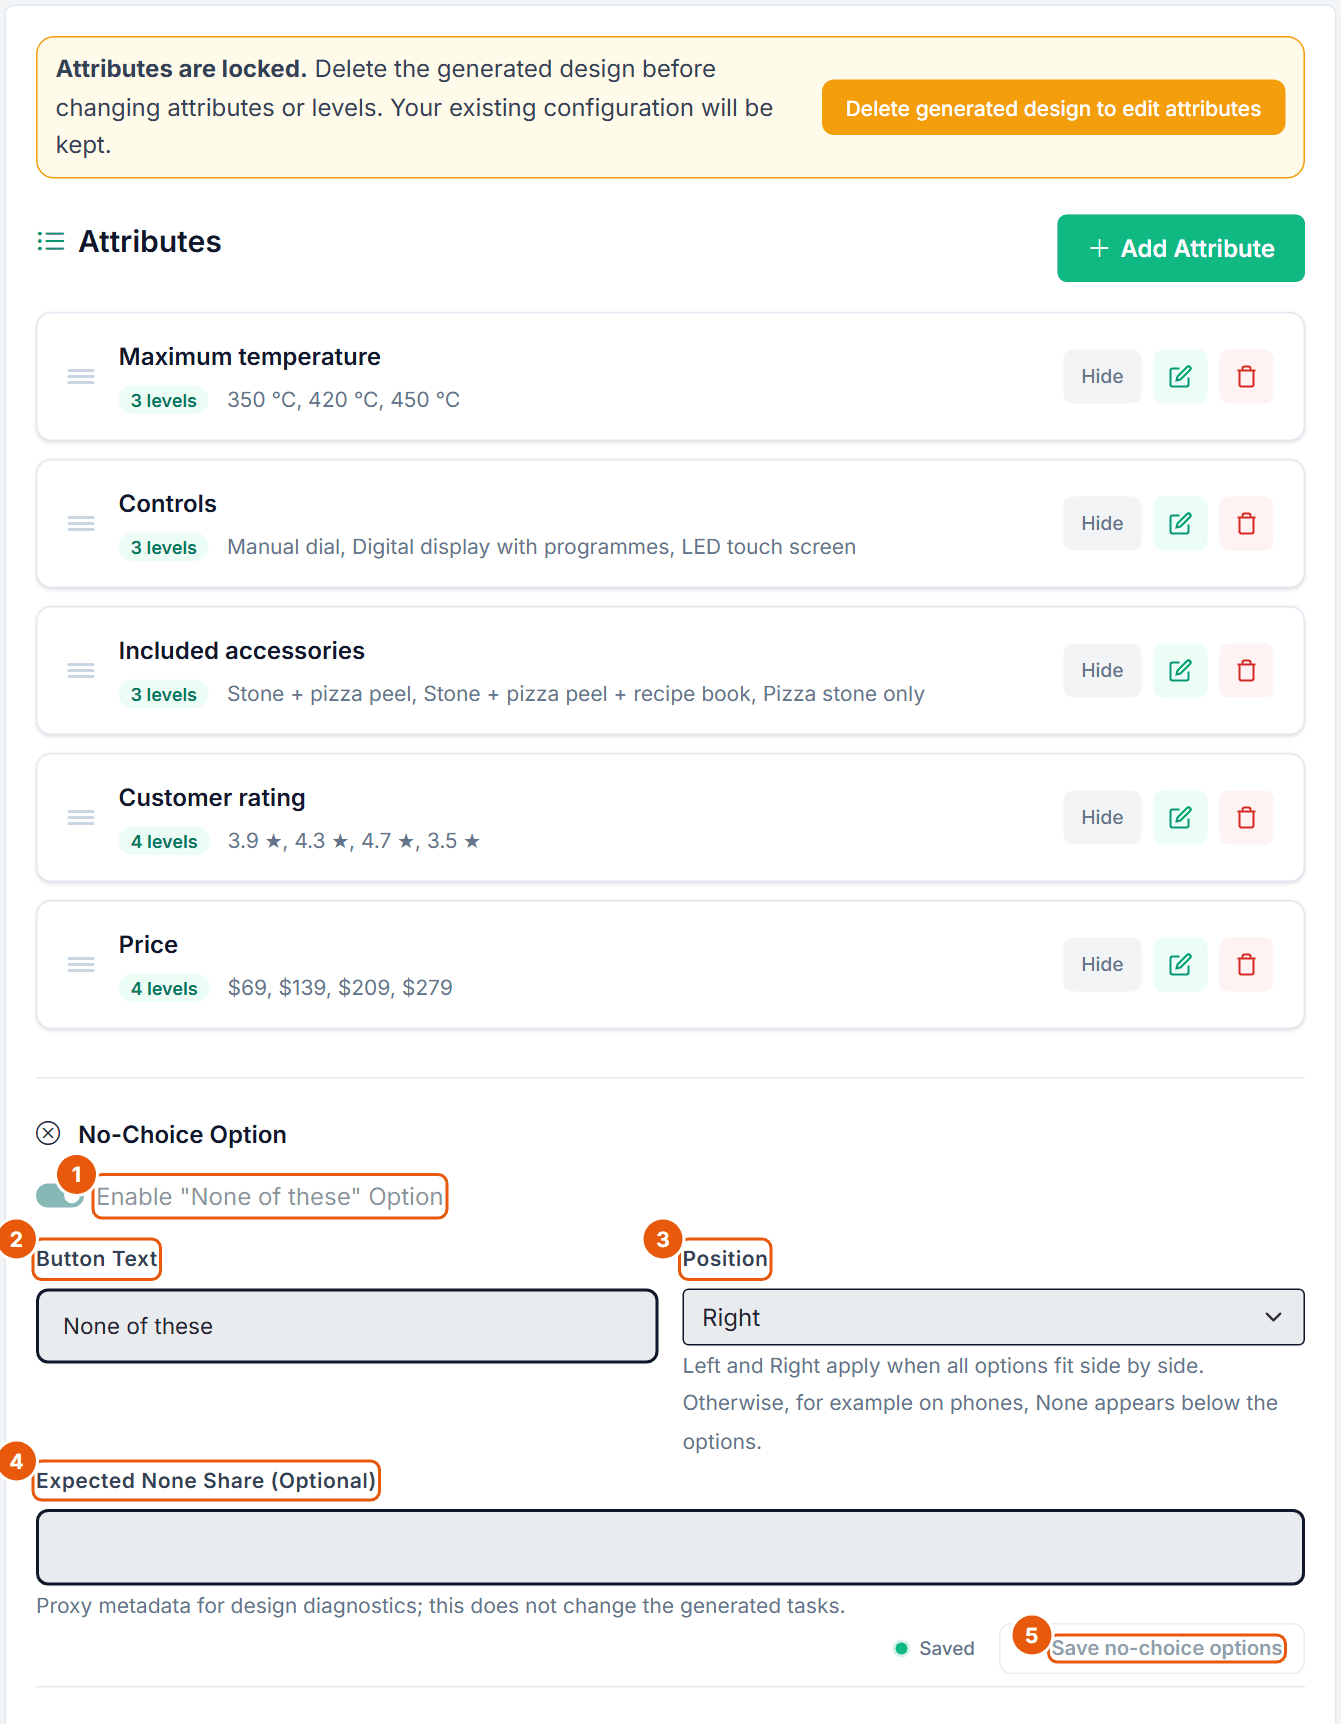
Figure 4. The No-Choice Option of the pizza oven task (greyed out because the design is generated).
No.
Control
What it does
1
Enable "None of these" Option
Adds the None choice to every task. On by default for a new CBC task.
2
Button Text
The label of the None choice, "None of these" by default (up to 200 characters).
3
Position
Below (default), Left or Right of the concepts. Left and Right only apply when all options fit side by side; otherwise, for example on phones, None appears below the options. The Pizza task uses Right.
4
Expected None Share (Optional)
Your guess of the None share, 0 to 1 (0 to 100 % is accepted too). It is metadata for the design diagnostics only and does not change the generated tasks.
5
Save no-choice options
Stores these settings. They are not saved with the General toolbar.
Should you keep the None option?
Usually yes. A None option makes the task more realistic and avoids forcing a choice that can exaggerate willingness to pay (Orme & Chrzan, 2017, ch. 5). Adding it also changes how people decide, so include it when it is feasible and salient (Rao, 2026, pp. 494-495). Expect a None share of about 5 to 20 % (Orme, 2020, p. 111), and note that it is unstable: it rises in later tasks and with harder tasks (Orme & Chrzan, 2017, ch. 5). Switch it off only when a forced choice is the right model. When "would you buy at all?" is the core question, a dual-response None (DR-CBC) keeps the full choice information (Orme & Chrzan, 2017, ch. 5; Hung, Liu, Brazell & Allenby, 2025).
6. Fixed Tasks
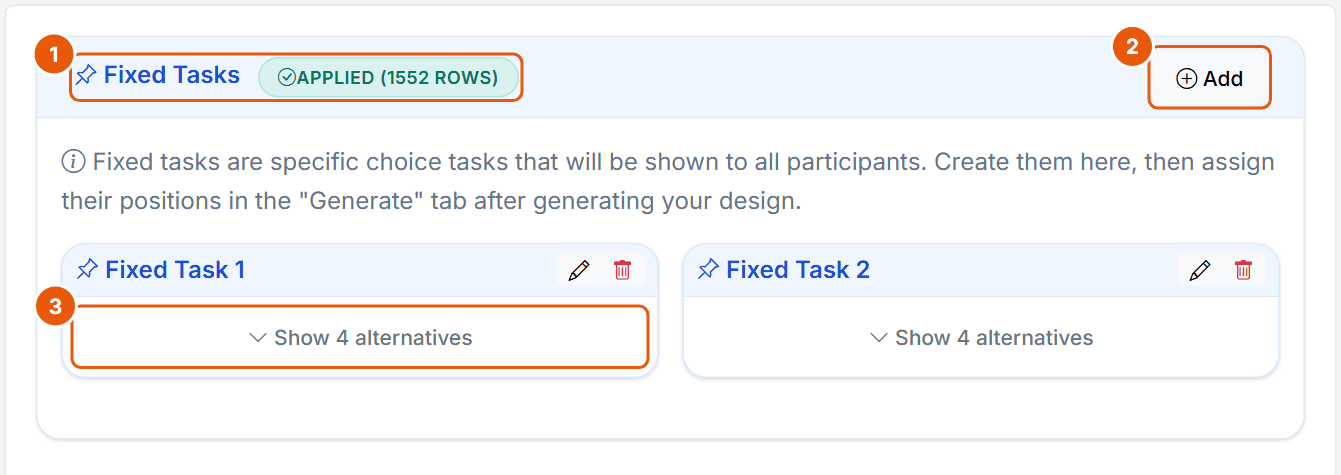
A fixed task shows the same concepts to every respondent. Choicery leaves fixed tasks out of estimation and uses them as holdouts to measure how well the model predicts (hit rates).
Figure 5. The Fixed Tasks step of the pizza oven task with two fixed tasks of four alternatives each.
No.
Control
What it does
1
Fixed Tasks + badge
"Applied (N rows)" when the fixed tasks are placed in the generated design (1552 rows in the example), "Draft (not applied)" when they are defined but not yet placed.
2
Add
Opens the Create Fixed Task dialog (Figure 6). At most 20 fixed tasks per task.
3
Show N alternatives
Expands the card to show the alternatives. The pencil edits, the bin deletes the fixed task.
Without fixed tasks the step warns: "No fixed tasks defined. Without fixed tasks, you cannot calculate predictive validity metrics (hit rates) for your CBC study." If you later delete or rename levels, an affected card turns red with " - incomplete" and lists the issues; fix or delete it before applying positions.
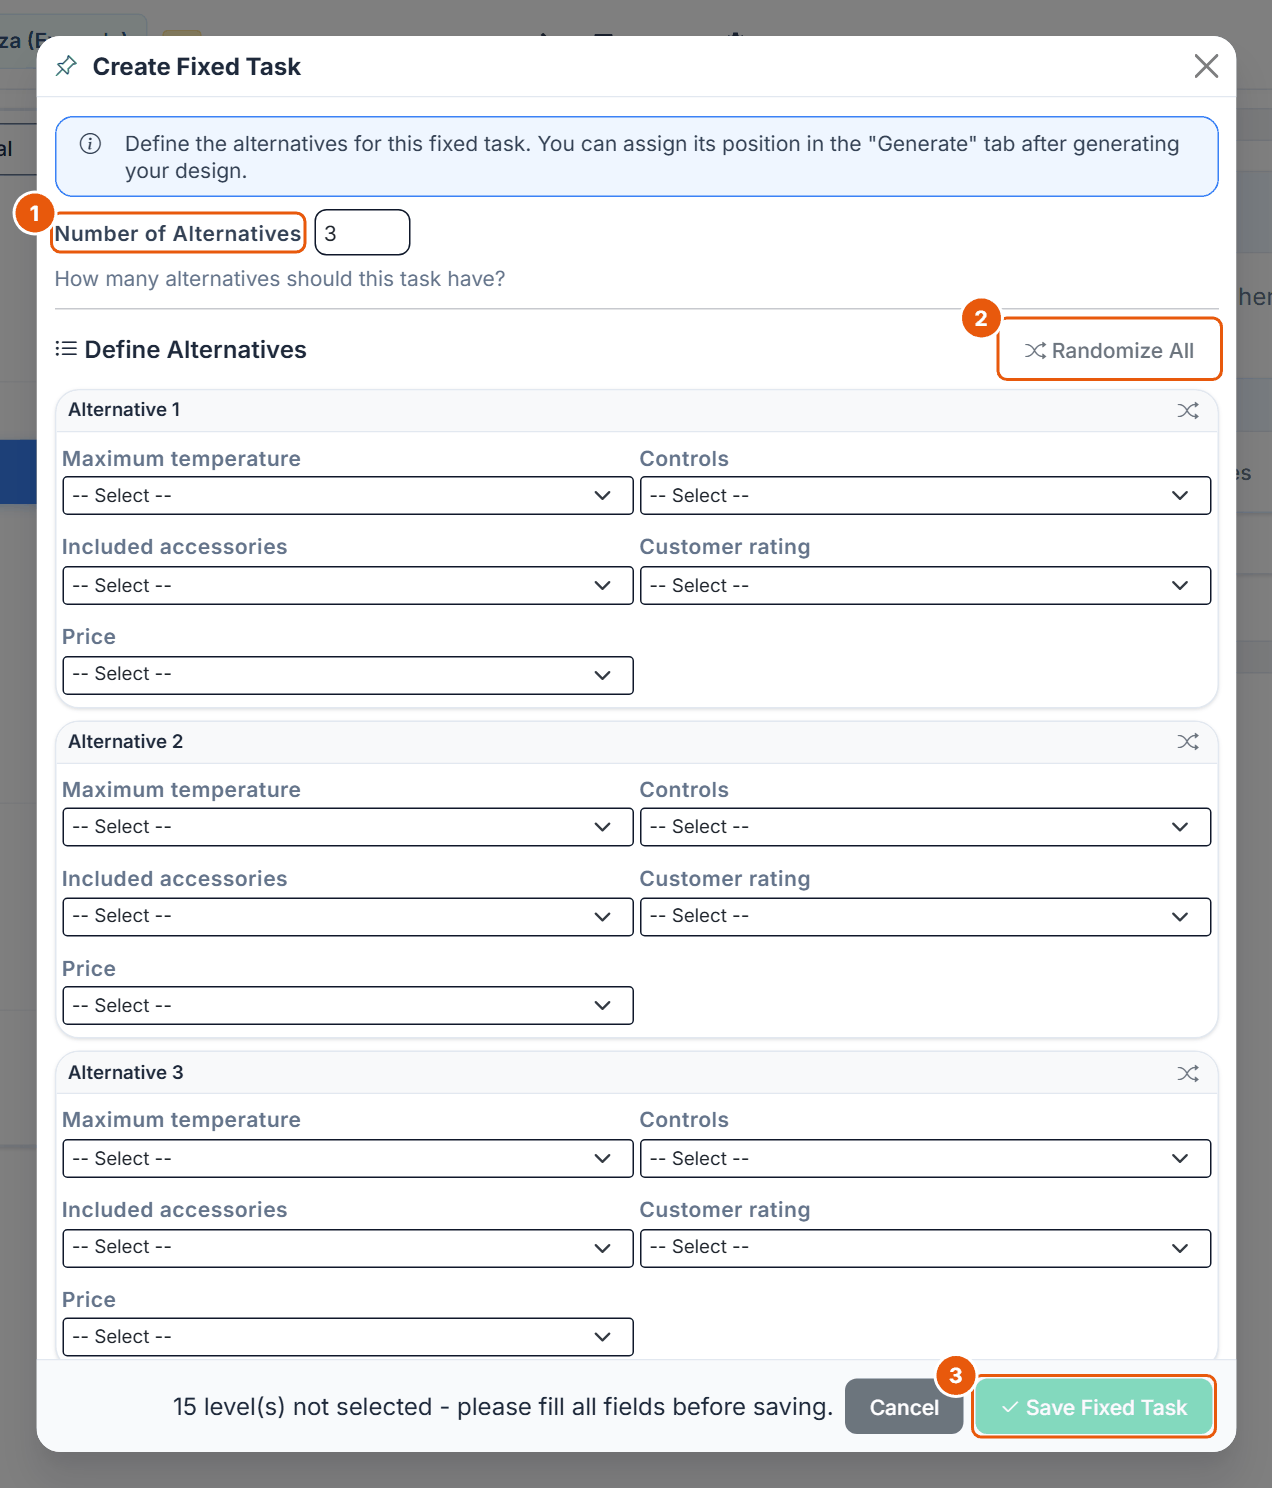
Figure 6. The Create Fixed Task dialog.
No.
Control
What it does
1
Number of Alternatives
2 to 9, default 3. A fixed task may show a different number of alternatives than the random tasks (the Pizza fixed tasks show 4).
2
Randomize All
Fills every selector with a random level. The shuffle icon on an alternative randomizes only that alternative.
3
Save Fixed Task
Disabled until every attribute of every alternative has a level; the footer counts the missing ones ("15 level(s) not selected").
Positions are set after generation on the Generate step (section 11).
How many holdouts?
"Just one fixed holdout choice task is not enough" (Orme, 2020, pp. 191-192). A simulation needed 7 in-sample holdouts to tell the right model from the wrong one for medium effects (Orme & Chrzan, 2017, ch. 6). Spread them among the design tasks instead of placing them all at the start or the end, and avoid holdouts with one dominant alternative (Orme & Chrzan, 2017, ch. 6).
7. Product Images
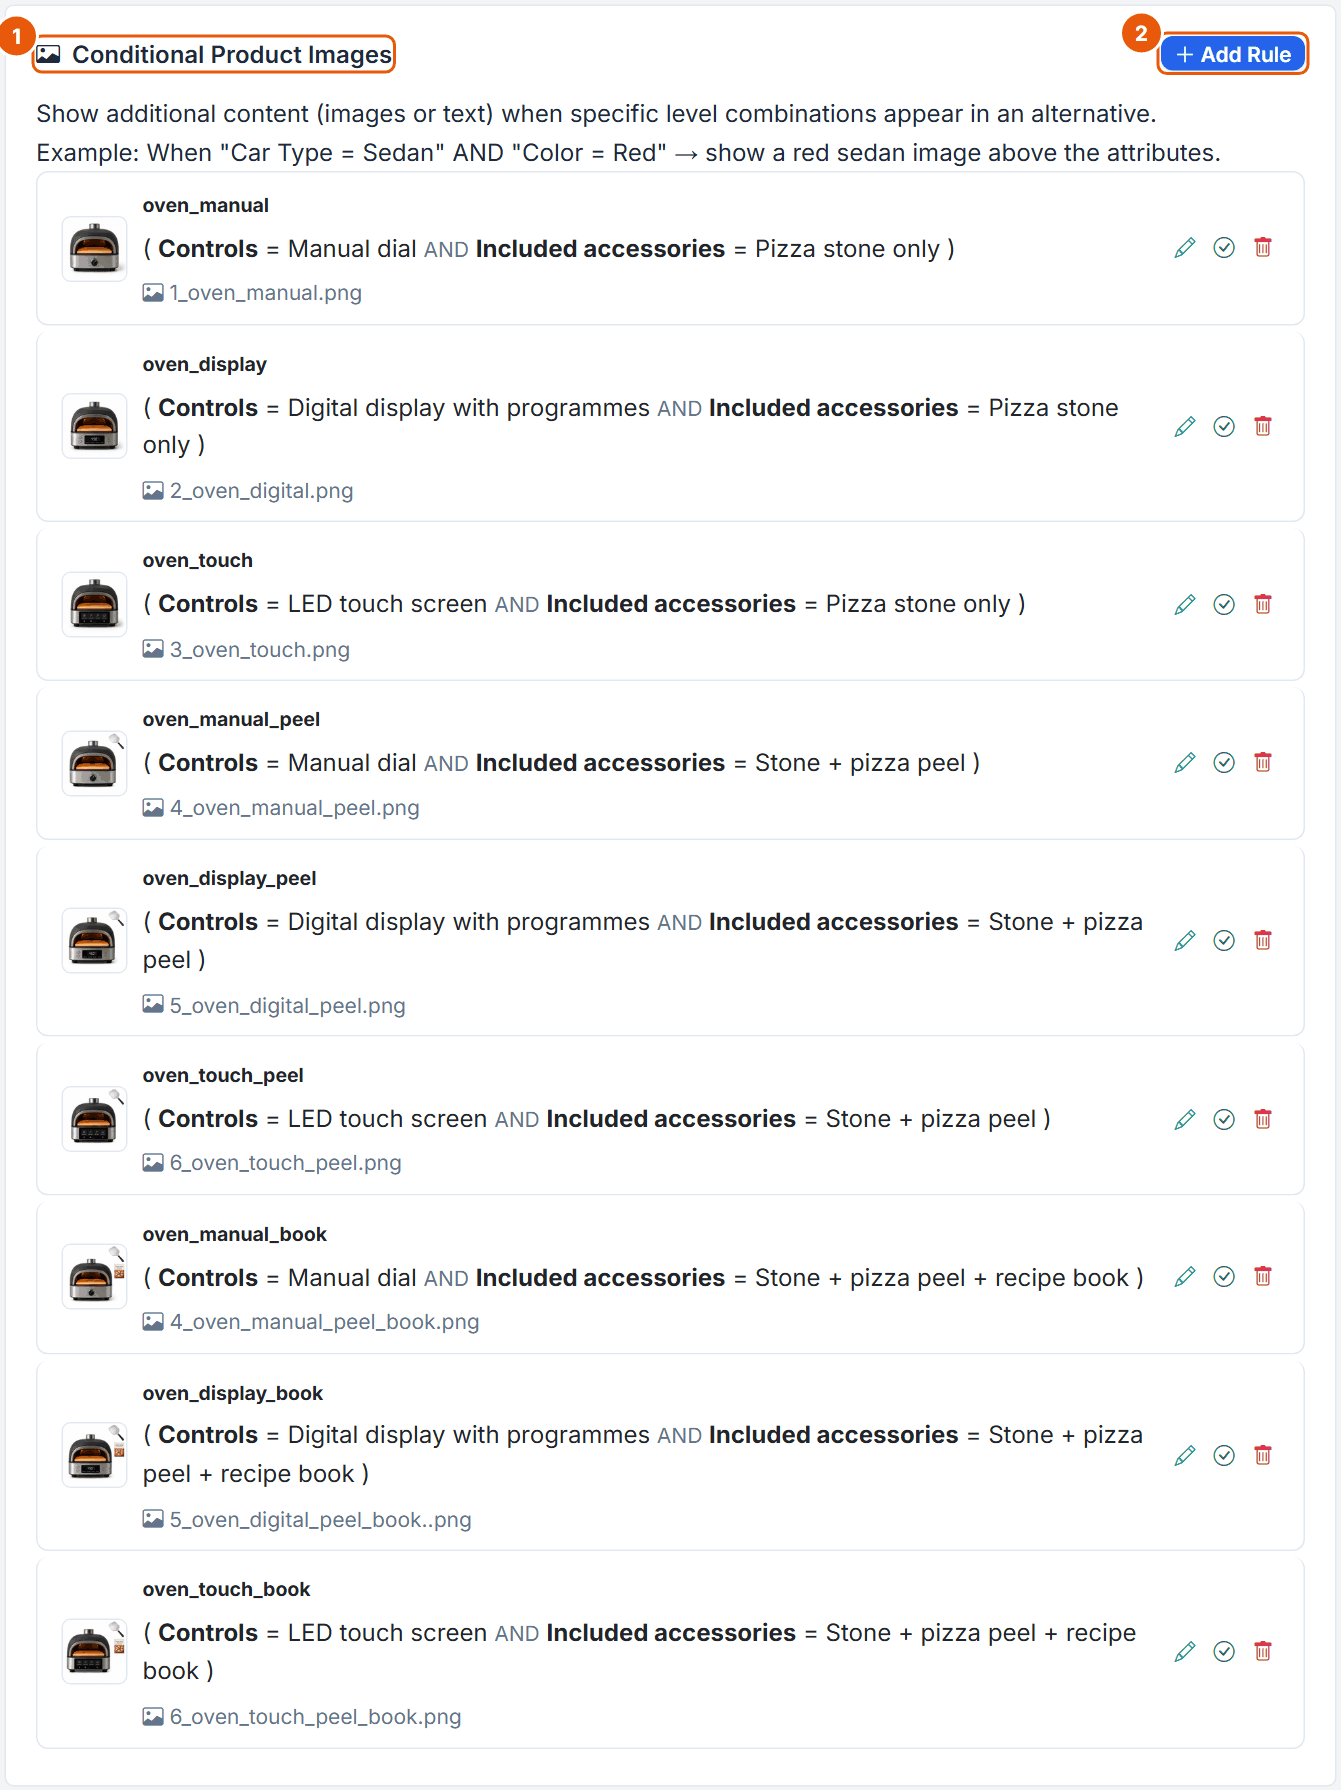
Product images are rules: when a concept contains a given combination of levels, Choicery shows an image (or a text block) above its attributes. This is how a concept gets a photo of the whole product.
Figure 7. The nine product image rules of the Pizza oven CBC task: each combination of Controls and Included accessories gets its own oven photo.
No.
Control
What it does
1
Conditional Product Images
The list of rules. Each row shows the rule name, its conditions, the image file, and icons to edit, switch the rule on or off, and delete it ("Delete Display Rule").
2
Add Rule
Opens the Add Product Image dialog (Figure 8). At most 30 rules per task.
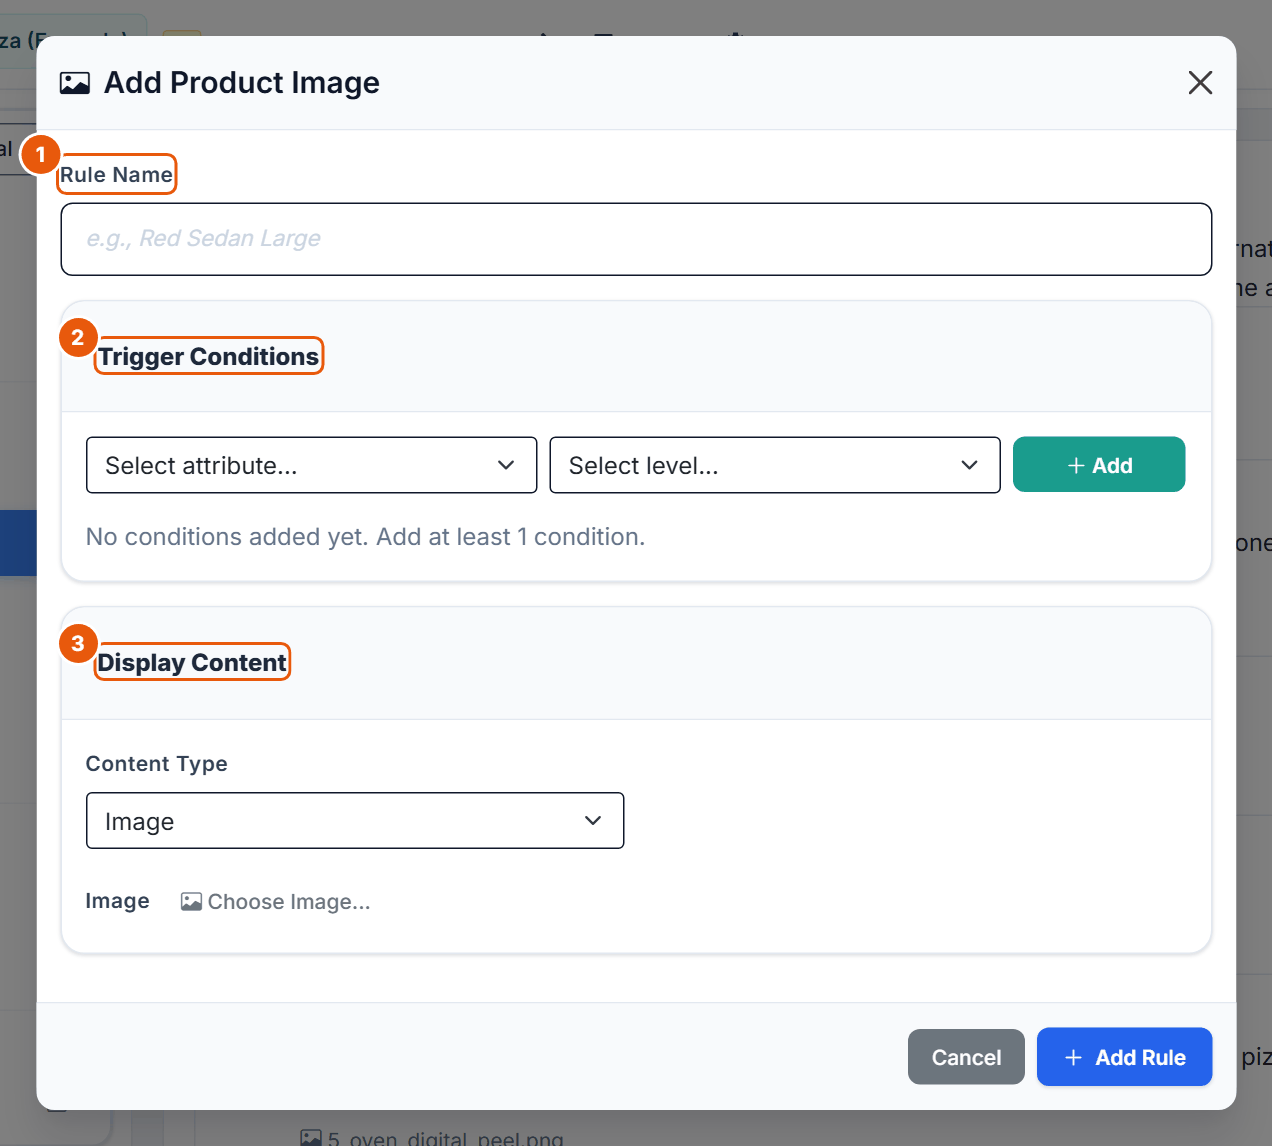
Figure 8. The Add Product Image dialog.
No.
Control
What it does
1
Rule Name
Up to 80 characters, for example oven_manual.
2
Trigger Conditions
Pick an attribute and a level, then Add. At least one condition. Conditions form groups with an AND/OR switch inside each group; New condition group adds another group, and groups are combined with AND. Preview shows the resulting expression.
3
Display Content
Content Type Image (pick one with Choose Image... from the project library) or Text (up to 1,000 characters). The content appears at the top of the concept.
Pizza example
The rule oven_manual has the conditions Controls = Manual dial AND Included accessories = Pizza stone only and shows the image 1_oven_manual.png. Nine rules cover the 3 x 3 combinations of Controls and Included accessories, so every concept gets a matching oven photo.
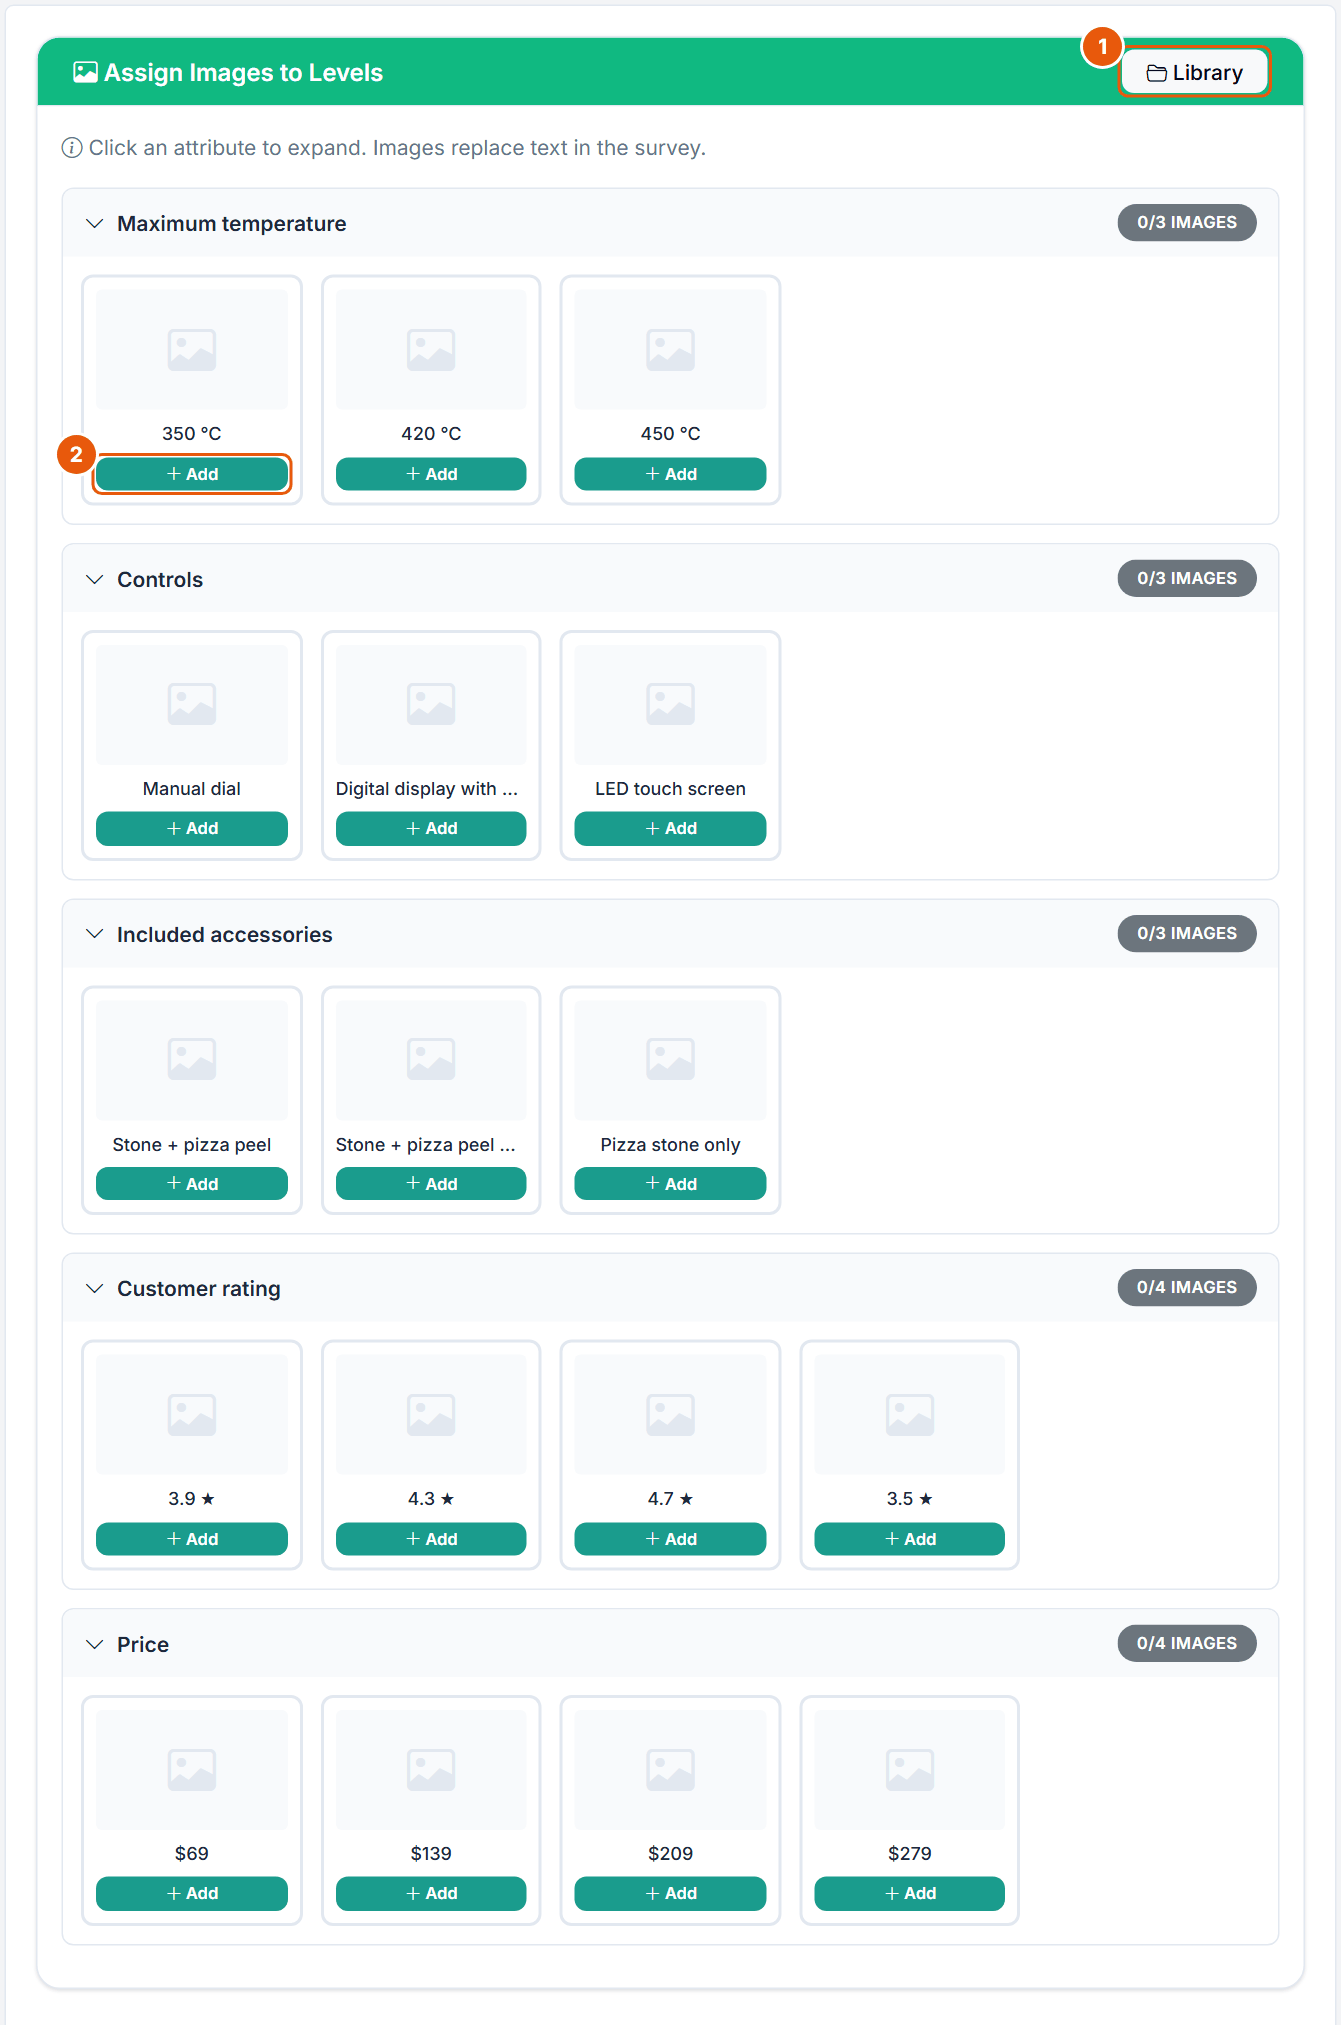
8. Level Images
A level image replaces the text of a single level in the survey, for example a colour swatch instead of the word "Red".
Figure 9. The Level Images step. The Pizza task uses product images instead, so no level has an image (0/3, 0/4 images).
No.
Control
What it does
1
Library
Opens the project image library, where you upload and manage images.
2
Add
Assigns an image to this level. Once a level has an image you can change or remove it (confirmation "Delete Image"). The badge on each attribute counts its images.
Once an attribute has at least one image, two more options appear for it: Hide attribute name and Images use the full card width. Image files may be PNG, JPG, JPEG, GIF or WebP, up to 5 MB and 4100 x 4100 px each (GIF up to 2 MB and 1024 px). A project holds up to 100 images and 200 MB; the account limit is 500 MB of images.
9. Prohibitions
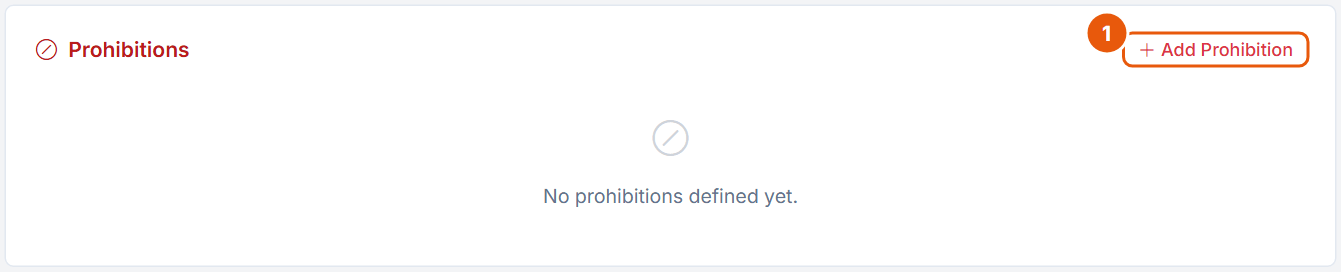
A prohibition forbids a combination of levels inside one concept, so the design never shows it.
Figure 10. The Prohibitions step. The Pizza task has no prohibitions.
No.
Control
What it does
1
Add Prohibition
Opens the Add Prohibition dialog (Figure 11). Disabled when there are no attributes or while a generated design exists ("Prohibitions are locked because a generated design exists. Delete the generated design on the Generate tab before changing prohibitions.").
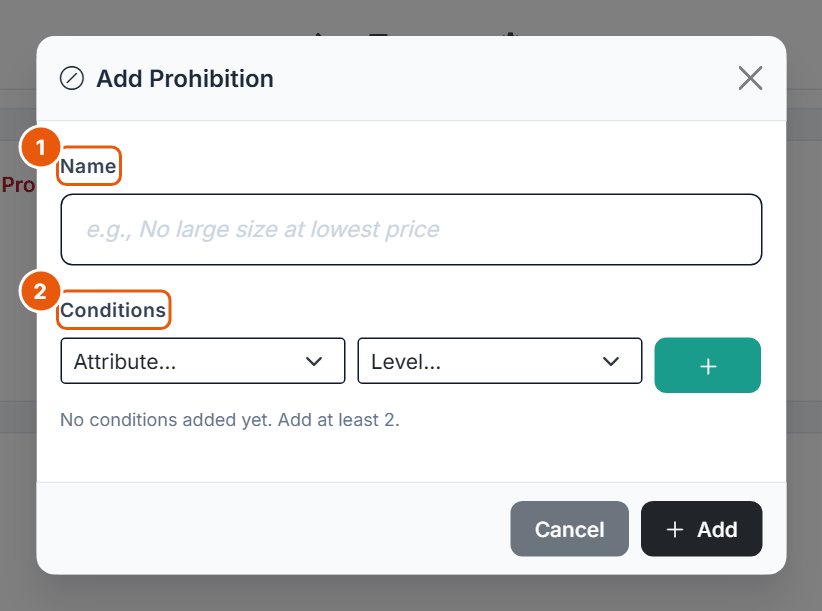
Figure 11. The Add Prohibition dialog.
No.
Control
What it does
1
Name
Required ("Please enter a name"), for example "No touch screen at $69".
2
Conditions
Pick an attribute and a level and click +. At least 2 conditions; each attribute only once per prohibition ("To forbid multiple levels, create separate prohibitions"). A prohibition may span more than two attributes. Confirm with Add.
Each prohibition can be switched off, edited or deleted. A task holds at most 50. After a change the editor reports side effects, for example "N fixed task(s) were removed from assigned positions" or "The generated design must be regenerated (N violating alternatives)". When the rules leave too few possible profiles, generation stops with an error instead of producing a broken design.
Use prohibitions sparingly
Too many prohibitions is "a common mistake" and can be "detrimental and sometimes fatal" (Orme, 2020, pp. 53-54). They almost always lower efficiency; in one example, price prohibitions cost at least 30 % (Orme & Chrzan, 2017, ch. 3). Alternatives are a combined attribute (for example "Controls and accessories" as one attribute) or conditional pricing. Compare the Per-Level SE Proxies with and without the prohibition before you keep it.
10. Templates
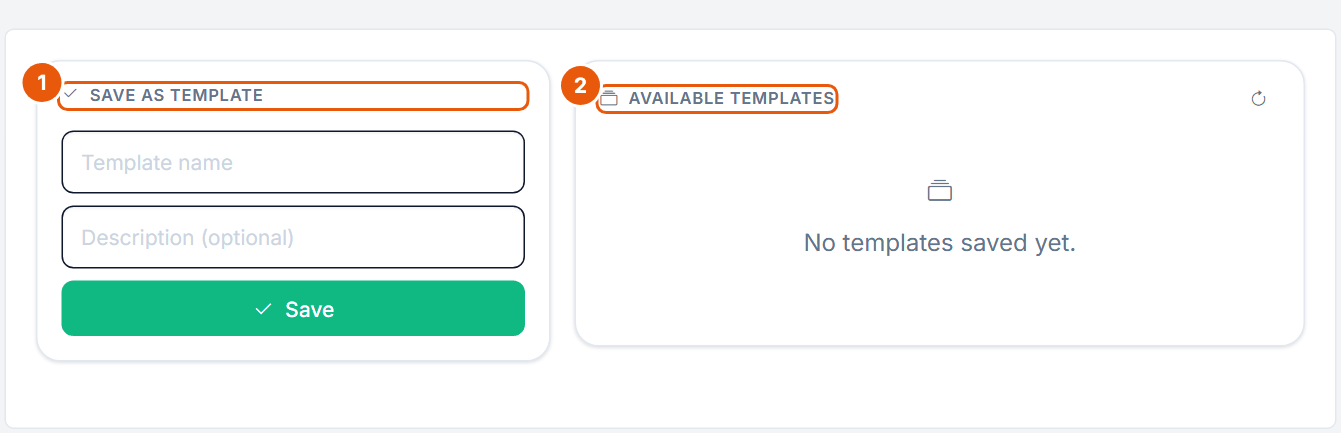
Figure 12. The Templates step.
No.
Control
What it does
1
Save as Template
Template name (required), Description (optional), Save. Disabled with "Define attributes first to save a template." while the task has no attributes.
2
Available Templates
Your templates with "N attr, M lvl" and badges (Images, Prohibitions, Cond. Display), a count and storage summary, and a refresh icon. Per template: Apply, rename, delete.
A template stores the whole configuration: attributes and levels, hidden attributes, level images (copied), prohibitions, product image rules, the General settings (question, footer, display settings), the No-Choice settings and the fixed tasks. Templates can be applied across CBC, DR-CBC, BW-CBC and CBC Shop. Applying asks "This will replace your current attributes, images, prohibitions, and product images." and in fact replaces all of the stored parts. It is refused while a generated design exists ("Delete the generated design before applying a template.").
11. Generate
The Generate step builds the experimental design: for every version, the list of tasks and the levels of every concept.
Before generation
Figure 13. The Generate step before a design exists, with the default values.
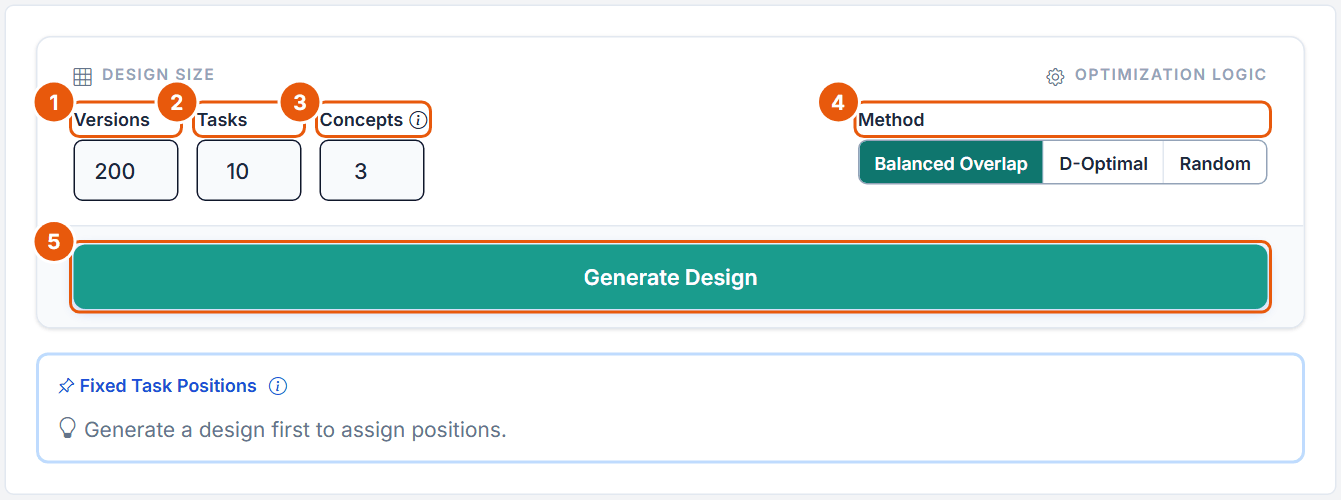
No.
Control
What it does
1
Versions
Number of different questionnaires (blocks). Each respondent gets one version; when there are more respondents than versions, versions are reused. 1 to 1,000, default 200.
2
Tasks
Number of random choice tasks per respondent. Fixed tasks are added on top (10 random + 2 fixed = 12 screens in the Pizza task). 1 to 30, default 10. Free plan: at most 6 tasks including active fixed tasks.
3
Concepts
Number of alternatives per task, without the None option. 2 to 9, default 3. Free plan: at most 3.
4
Method
Balanced Overlap (default, "recommended"): level and pair balancing with a moderate share of repeated levels within a task. D-Optimal: a coordinate-exchange search that minimises the D-error of a main-effects logit with zero priors; slower. Random: simple random sampling without optimization.
5
Generate Design
Starts generation. A progress panel with Cancel appears; generation stops after at most 300 seconds.
There is no seed field: every run draws a new random seed, so generating again gives a different design. The editor warns when Concepts exceed the levels of an attribute ("Repeated levels are unavoidable with N alternatives for X (k levels)"). Server checks: "Number of versions must be between 1 and 1000", "Number of tasks must be between 1 and 30", "Number of alternatives must be between 2 and 9", and on the Free plan "<Plan> allows N choice tasks per respondent, fixed tasks included."
After generation
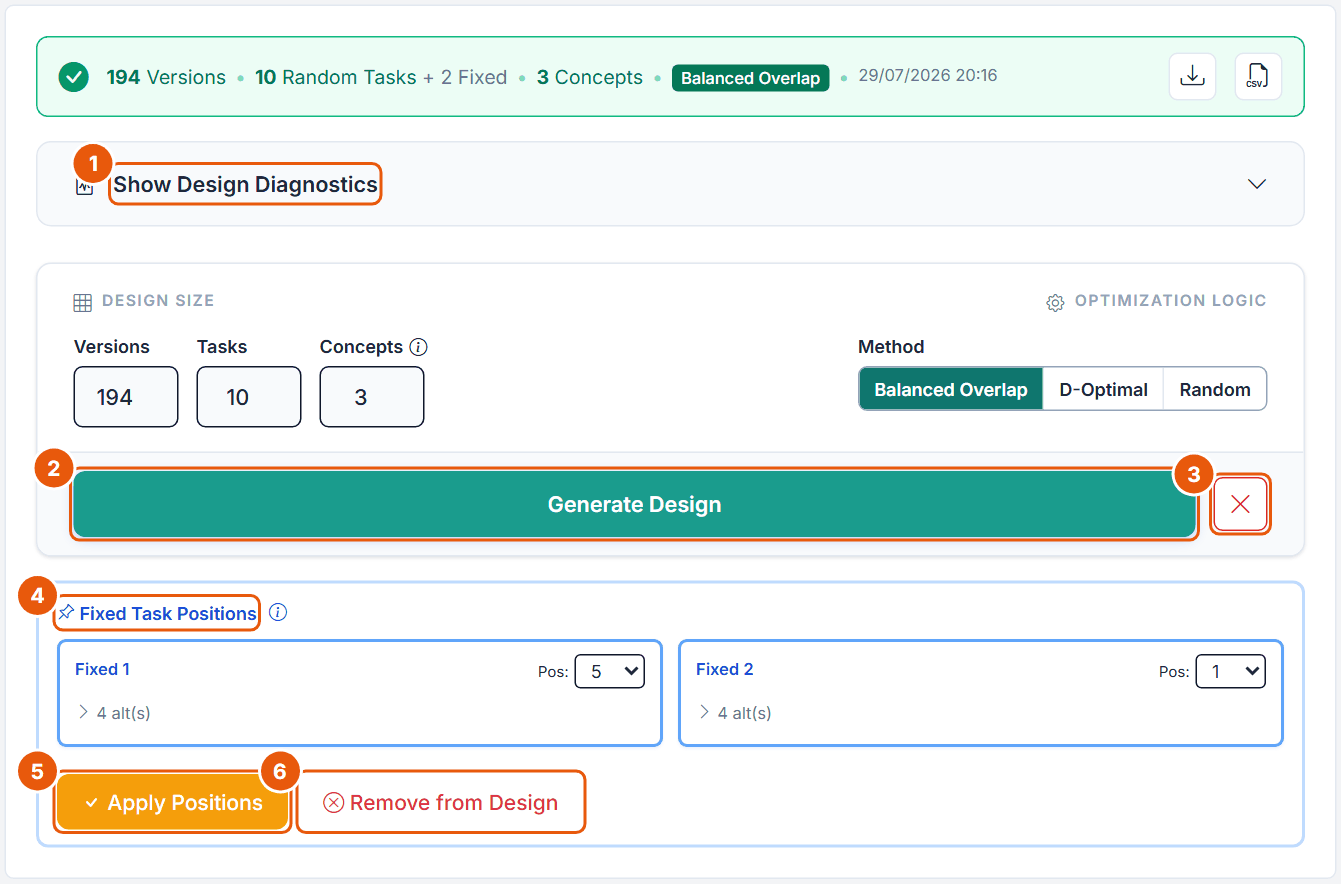
Figure 14. The Generate step of the pizza oven task after generation: 194 versions, 10 random tasks plus 2 fixed, 3 concepts, Balanced Overlap.
No.
Control
What it does
1
Show Design Diagnostics
Opens the diagnostics (section 12).
2
Generate Design
Generates again. Asks "Replace existing design?" first, because the new design replaces all choice tasks and statistics. Blocked once responses exist.
3
Delete design
Deletes the generated design and unlocks attributes and prohibitions. Disabled with "Design locked: responses already collected. Delete all responses to unlock." when responses exist.
4
Fixed Task Positions
One card per fixed task with a Pos: selector from 1 to the total number of tasks. Position 1 is the first task shown; position 2 comes after the first random task, and so on. Each position may be used once.
5
Apply Positions
Inserts the fixed tasks at the chosen positions in every version. Until then the hint reads "No positions assigned yet."
6
Remove from Design
Takes all fixed tasks out of the design. Their definitions stay on the Fixed Tasks step.
The green status bar summarises the design ("194 Versions", "10 Random Tasks + 2 Fixed", "3 Concepts", the method and the date). Its two buttons download the design report and the design CSV. While responses exist, a notice says how many were collected and that a new design is blocked until they are permanently deleted.
How many versions?
More versions are "bigger is better" in principle, but about 10 to 12 good versions capture most of the value, and very large numbers bring little extra (Orme & Chrzan, 2017, ch. 3). The default of 200 is safe. HB needs a good design within each version, which Balanced Overlap provides.
12. Design Diagnostics
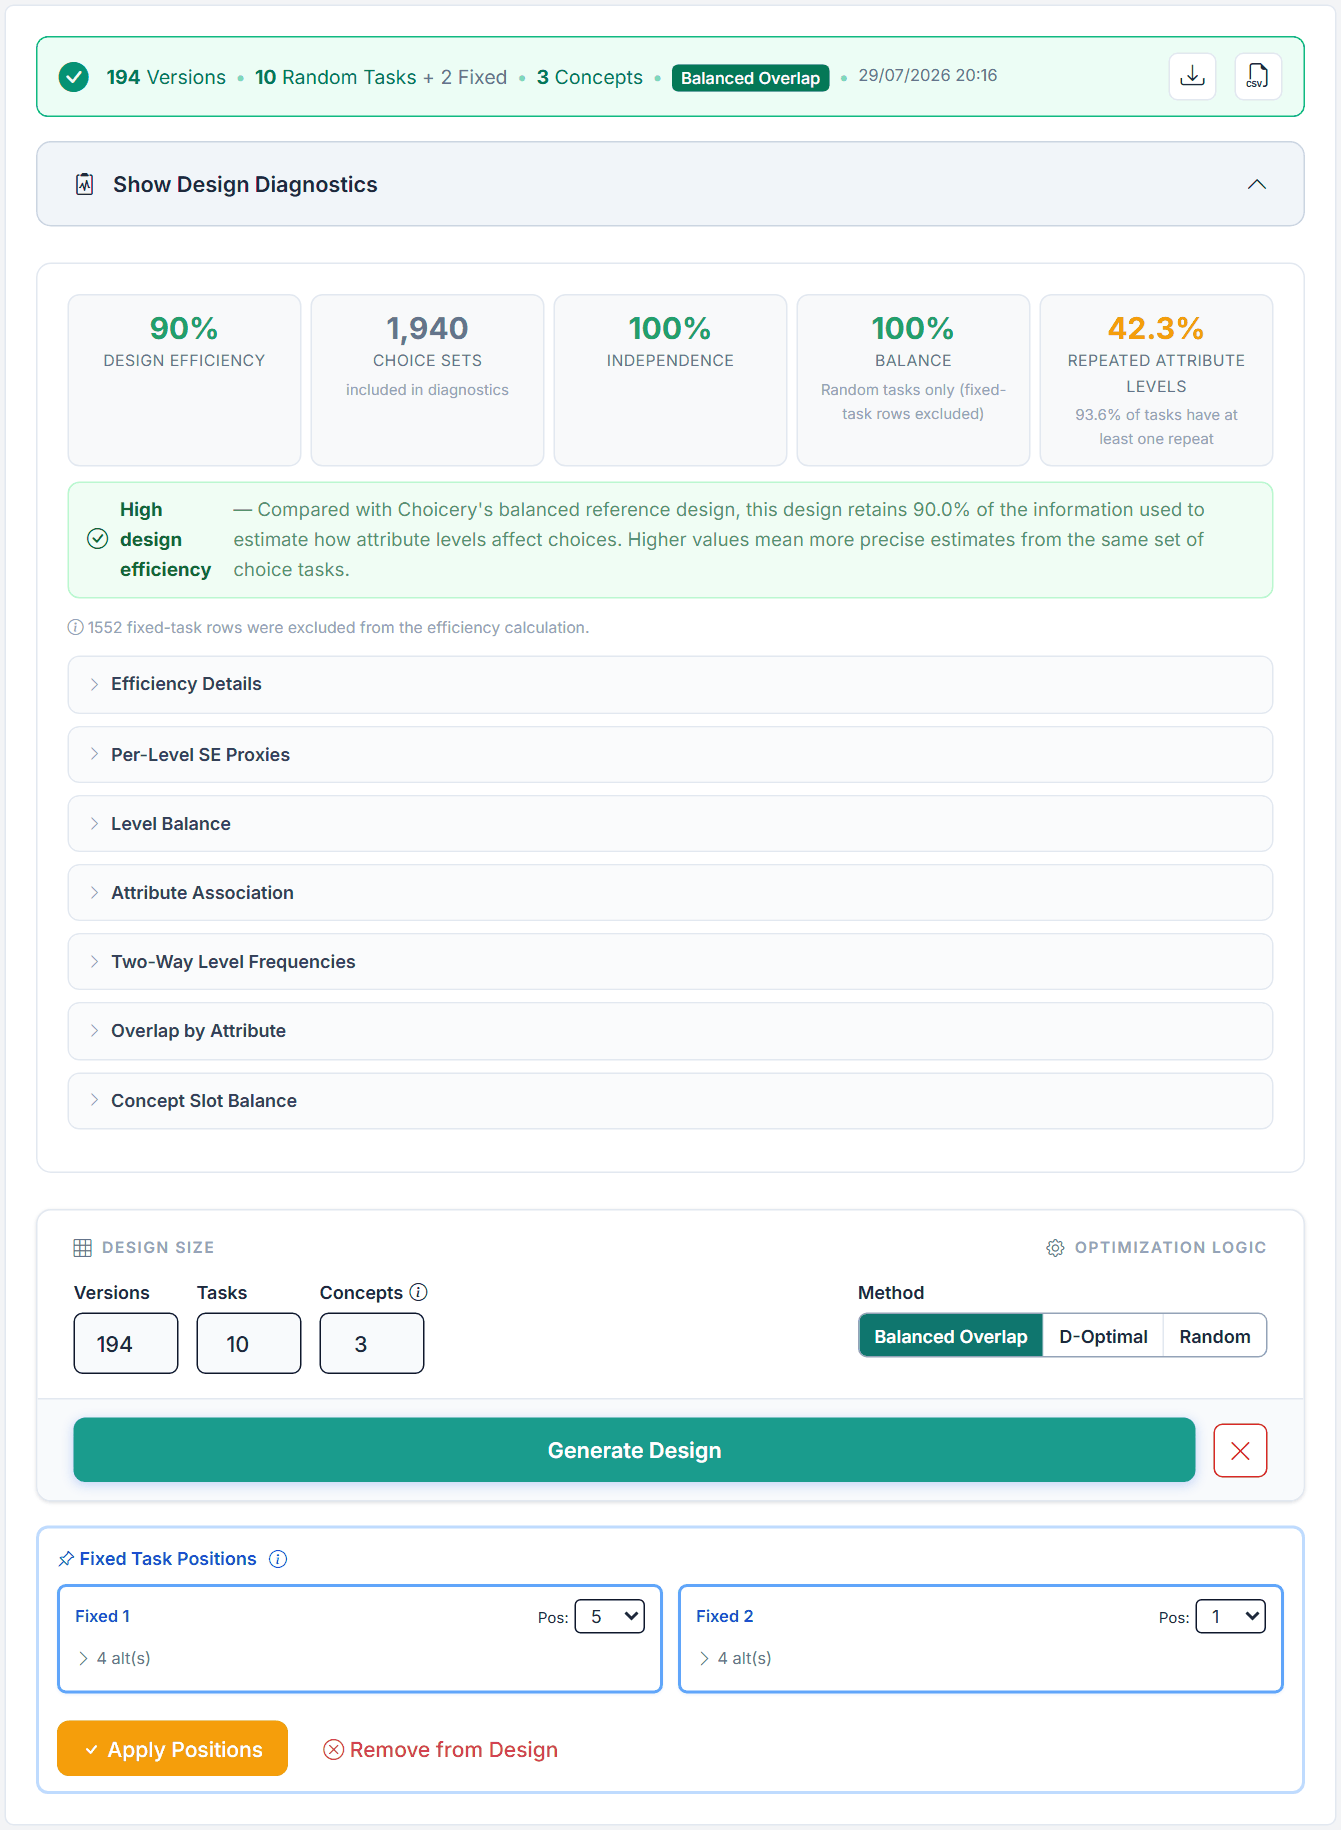
Figure 15. The Design Diagnostics of the pizza oven task: 90 % design efficiency, 1,940 choice sets, 100 % independence and balance, 42.3 % repeated attribute levels.
Element
What it shows
What to do
Design Efficiency
How precisely the design estimates the level effects, compared with Choicery's balanced reference design (100 % = the reference). The status band below names the result: Excellent (at least 98 %), Very high (95 to below 98 %), High (90 to below 95 %), Good (80 to below 90 %), or "Low design efficiency - review recommended" (below 80 %). "Not estimable" means the main-effects model cannot be estimated from this design.
Below 80 %: check prohibitions, raise the number of tasks or versions, or try another method.
Choice Sets
Number of random tasks across all versions (194 x 10 = 1,940).
Information only.
Independence
How independently the attributes vary. Higher makes the separate effects easier to estimate.
Low values usually come from prohibitions.
Balance
How evenly the levels appear (100 % = all equally often), random tasks only.
Low values point to prohibitions or very few versions.
Repeated Attribute Levels
Share of attribute comparisons in which two or more concepts show the same level, plus the share of tasks with at least one repeat. Lower is generally better for main effects; Balanced Overlap keeps a moderate amount on purpose.
With 3 concepts and 3-level attributes some repeats are expected. Very high values: check the method.
Table 3. The tiles of the Design Diagnostics.
Further lines and sections:
"N prohibitions applied to this design" when prohibitions exist, and "N fixed-task rows were excluded from the efficiency calculation." when fixed tasks are placed (fixed tasks are holdouts, not design).
Efficiency Details: D-efficiency and its basis, A-Efficiency Ratio, number of parameters, No-Choice ASC and Expected None Share when the None option is on, condition number and whether the model is identified.
Per-Level SE Proxies: the expected standard error of each level. A common target is 0.05 or less for main effects (Orme & Chrzan, 2017, ch. 3).
Level Balance: how often each level appears.
Attribute Association: maximum association between attributes, coded orthogonality and the maximum cross-attribute coded correlation.
Two-Way Level Frequencies: how often pairs of levels from two attributes appear together.
Overlap by Attribute: the repeat rate per attribute.
Concept Slot Balance: a score and the maximum slot imbalance, showing whether levels are spread evenly over the concept positions (first, second, third concept).
Modest overlap is intended: overlap designs usually give more precise main effects for real respondents than minimal-overlap designs (Orme, 2020, p. 110; Orme & Chrzan, 2017, ch. 3), while textbooks on statistical efficiency favour minimal overlap (Rao, 2026, pp. 174-176). Prohibitions and diagnostics remain the place to check a design before fielding.
13. Preview and the Respondent View
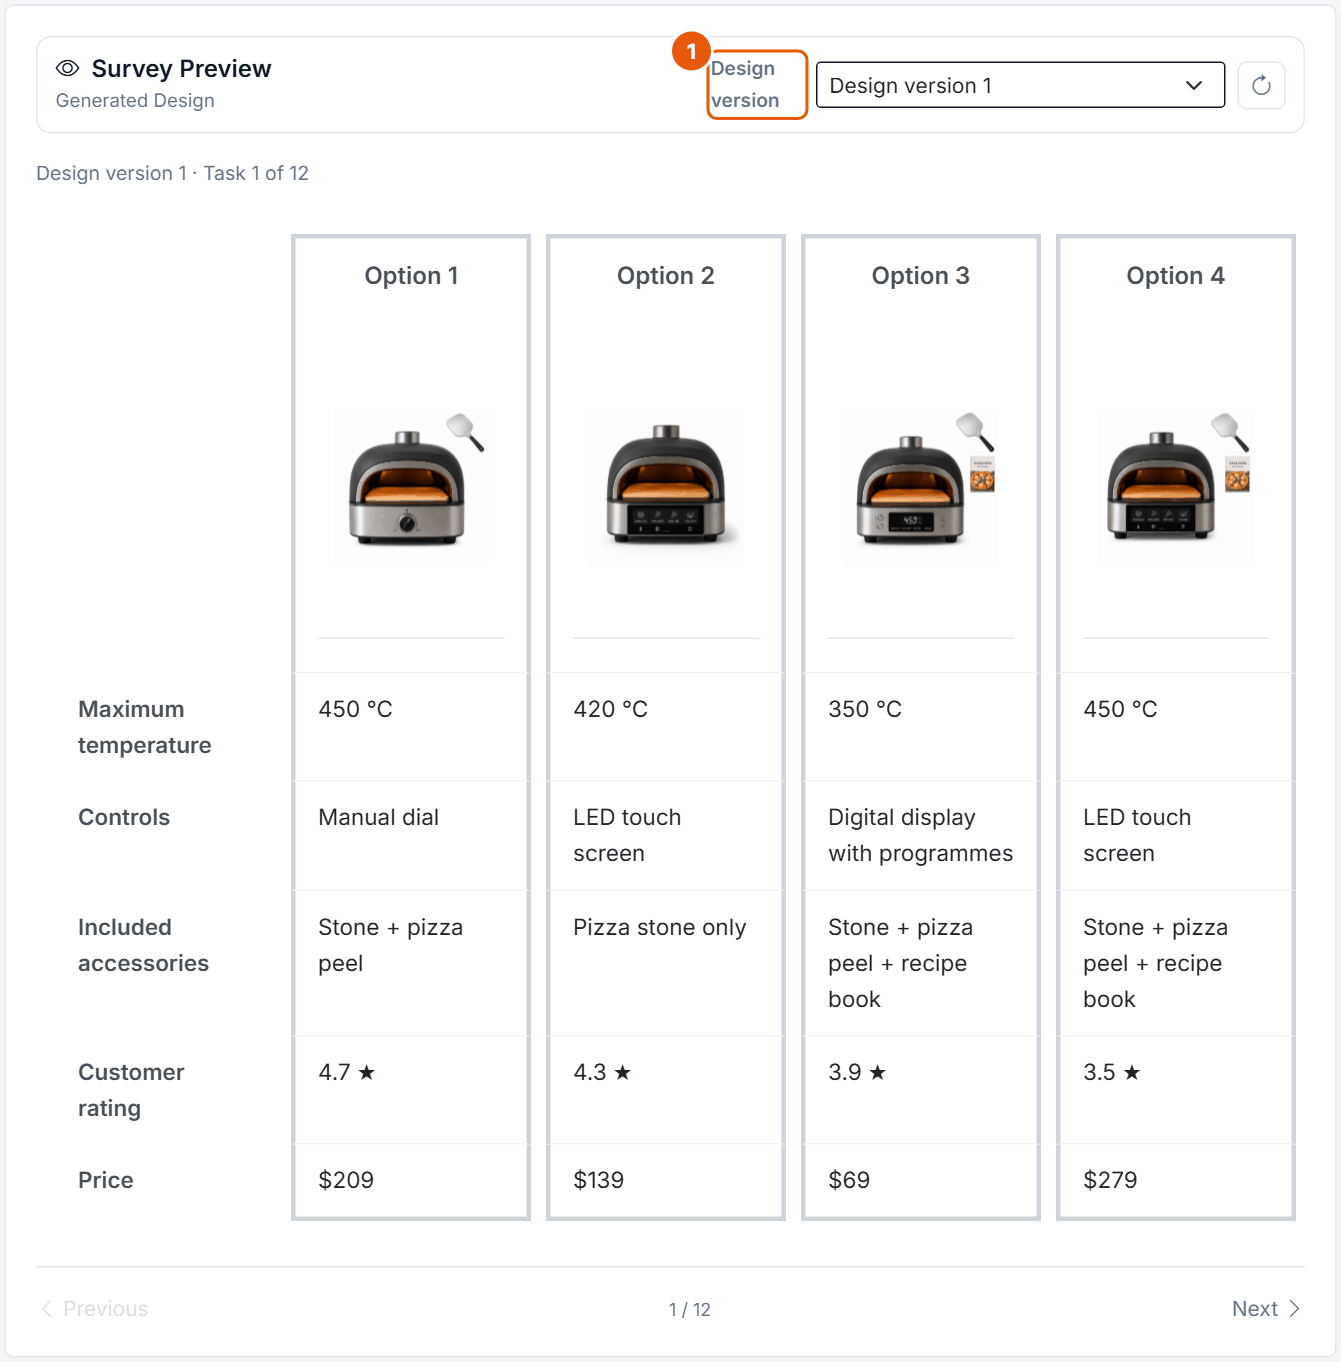
Figure 16. The Preview step: task 1 of 12 of design version 1. Task 1 is a fixed task with four alternatives (Fixed 2 is placed at position 1).
No.
Control
What it does
1
Design version
Picks the version to preview; the button next to it reloads. Previous and Next page through the tasks.
Before a design exists the step shows "Example Preview" with example tasks, so you can judge the layout early. A stale design shows "This preview uses a design that conflicts with active prohibitions. Regenerate it before relying on the preview."
In the survey, each task appears under your question, with the option headers if they are switched on. The respondent selects a concept by clicking its card, which is then outlined; there is no check mark and no separate select button. The None option appears at its chosen position. The back button is disabled on CBC pages, so earlier tasks cannot be revised. Each shown level is recorded; the chosen concept is the outcome and the other concepts are what it beat.
14. How Large Should Your Study Be?
The editor accepts up to 20 attributes with 20 levels each, 30 tasks and 9 concepts. These are technical limits, not recommendations. The literature recommends far smaller studies.
Setting
Recommendation
Choicery limit
Sources
Attributes
About 6 to 8 at most in full-profile CBC. Above that, respondents simplify.
20 (Free plan 4)
Orme (2020, pp. 49-50)
Levels per attribute
2 to 5; about 5 at most for price; keep the counts balanced across attributes.
2 to 20 (Free plan 4)
Orme (2020, pp. 52-53); Rao (2026, pp. 74-75)
Tasks per respondent
8 to 12; about 12 for individual (HB) utilities; more than about 15 no longer helps.
1 to 30, default 10 (Free plan 6 incl. fixed)
Orme (2020, p. 109); Orme & Chrzan (2017, ch. 18); Goeken et al. (2024, p. 150)
Concepts per task
3 to 5. With 4 or more, respondents in involving categories screen down to about 2.
2 to 9, default 3 (Free plan 3)
Orme (2020, pp. 47, 62); Rao (2026, p. 234); Orme & Chrzan (2017, ch. 4)
Sample size (rule)
n x t x a / c ≥ 500, better 1,000 (n respondents, t tasks, a concepts without None, c the largest number of levels of any attribute).
none
Orme (2020, p. 64); Orme & Chrzan (2017, ch. 8)
Sample size (minimum)
At least 300 respondents, or 200 per subgroup you report, whichever is greater. Plan to discard 10 to 30 % bad respondents.
Include when feasible; expect about 5 to 20 % None; the share is unstable.
on/off
Orme (2020, p. 111); Orme & Chrzan (2017, ch. 5); Rao (2026, pp. 494-495)
Holdout (fixed) tasks
More than one; a simulation needed 7 in-sample holdouts for medium effects.
up to 20
Orme (2020, pp. 191-192); Orme & Chrzan (2017, ch. 6)
Versions
About 10 to 12 good versions capture most of the value.
1 to 1,000, default 200
Orme & Chrzan (2017, ch. 3)
Prohibitions
Sparingly or not at all.
up to 50
Orme (2020, pp. 53-54); Orme & Chrzan (2017, ch. 3)
Table 4. Recommended values and the Choicery limits. Page numbers refer to the editions in the references.
Pizza example: the sample-size rule
The pizza oven task has t = 10 random tasks, a = 3 concepts and c = 4 (Customer rating and Price have 4 levels). The rule gives n ≥ 500 x 4 / (10 x 3) = 67 respondents, or 134 for the stricter 1,000. The minimum of 300 respondents is therefore the binding value, and 200 per subgroup if you report subgroups.
n x t x a / c >= 500
n >= 500 x 4 / (10 x 3) = 66.7, so 67
n >= 1,000 x 4 / (10 x 3) = 133.3, so 134
Minimum: max(300, 200 per reported subgroup)
Where the sources disagree
Maximum number of attributes. Orme (2020, p. 50) names 6 to 8 as the comfort zone. In Rao (2026, p. 527, chapter by Orme) CBC is recommended for four attributes or fewer, with adaptive methods for more. Orme and Chrzan (2017, ch. 7) only worry at 15 or more. Treat 6 to 8 as a rule of thumb, not a hard limit.
Number of tasks. Practitioner sources give 8 to 12 (Orme, 2020, p. 109). A meta-analysis found that in standard CBC predictive validity can peak well before the last task (Sablotny-Wackershauser et al., 2024, Web Appendix H, pp. 139-140). More tasks are not automatically better.
Sample-size threshold. Orme (2020, p. 64) calls 500 the minimum and recommends 1,000 or more; Orme and Chrzan (2017, ch. 8) state 1,000.
Holdouts. Older ratings-based practice uses "usually 2 or so" (Rao, 2026, p. 122); the simulation in Orme and Chrzan (2017, ch. 6) needs many more.
Further evidence worth knowing
Number-of-levels effect. Attributes with more levels receive more importance, partly as an artefact of the level count (Orme, 2020, pp. 52-53; Rao, 2026, pp. 74-75). Do not split an attribute into more levels to make it look important.
Concept position. Without randomized order, the first concept was chosen 39.6 % of the time and the third 24.5 % in one study (Mao, Kessels & Mee, 2025, p. 2). Concept Slot Balance in the diagnostics checks that levels are spread over positions.
Price knowledge and None. When respondents do not know market prices, they learn them during the tasks and the None share grows; telling them typical prices before the tasks removed this effect (Hung, Kurz, Bailey, Huber & Allenby, 2025, pp. 11-12). A short introduction page before the CBC task is a simple remedy.
Reliability. Repeating one task at the end measures how consistently respondents answer; across eight replicated studies with binary choices, about 77 % of repeated choices matched, and the authors expect lower values with more than two concepts (Clayton et al., 2026, pp. 18-19).
15. Estimating Utilities
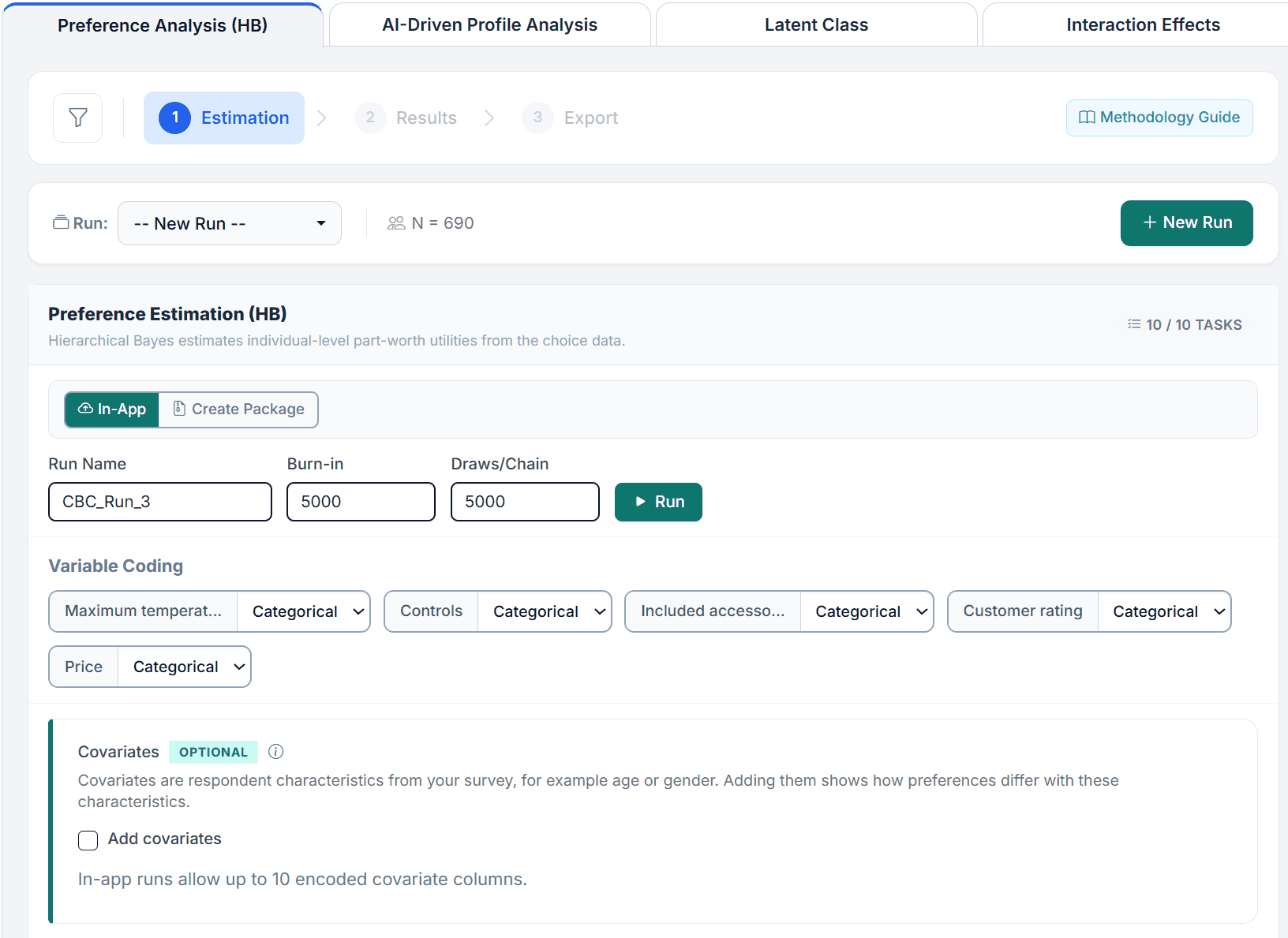
Once responses are collected, open Conjoint Analysis. The tabs across the top offer Preference Analysis (HB), AI-Driven Profile Analysis, Latent Class and Interaction Effects. Preference Analysis (HB) is the standard and the input the Market Simulator needs. It follows three steps: 1 Estimation, 2 Results, 3 Export. Fixed tasks are left out of estimation automatically.
Figure 17. The Estimation step for the pizza oven task (N = 690, 10 of 10 tasks): Run Name, Burn-in and Draws/Chain set to 5,000 / 5,000 (the defaults are now 10,000 / 10,000), Variable Coding, the In-App / Create Package switch and the Covariates panel.
Give the run a name, keep the defaults for a first run, and click Run. Price can be coded as a linear attribute in Variable Coding. Every setting, the In-App and Create Package modes, covariates and the convergence diagnostics are explained in the Preference Analysis (HB) guide.
Which pairs of attributes interact instead of just adding up
You want to test for attribute interactions
Table 5. The four analysis tabs in Conjoint Analysis, each with its own guide.
16. Interpreting the Results
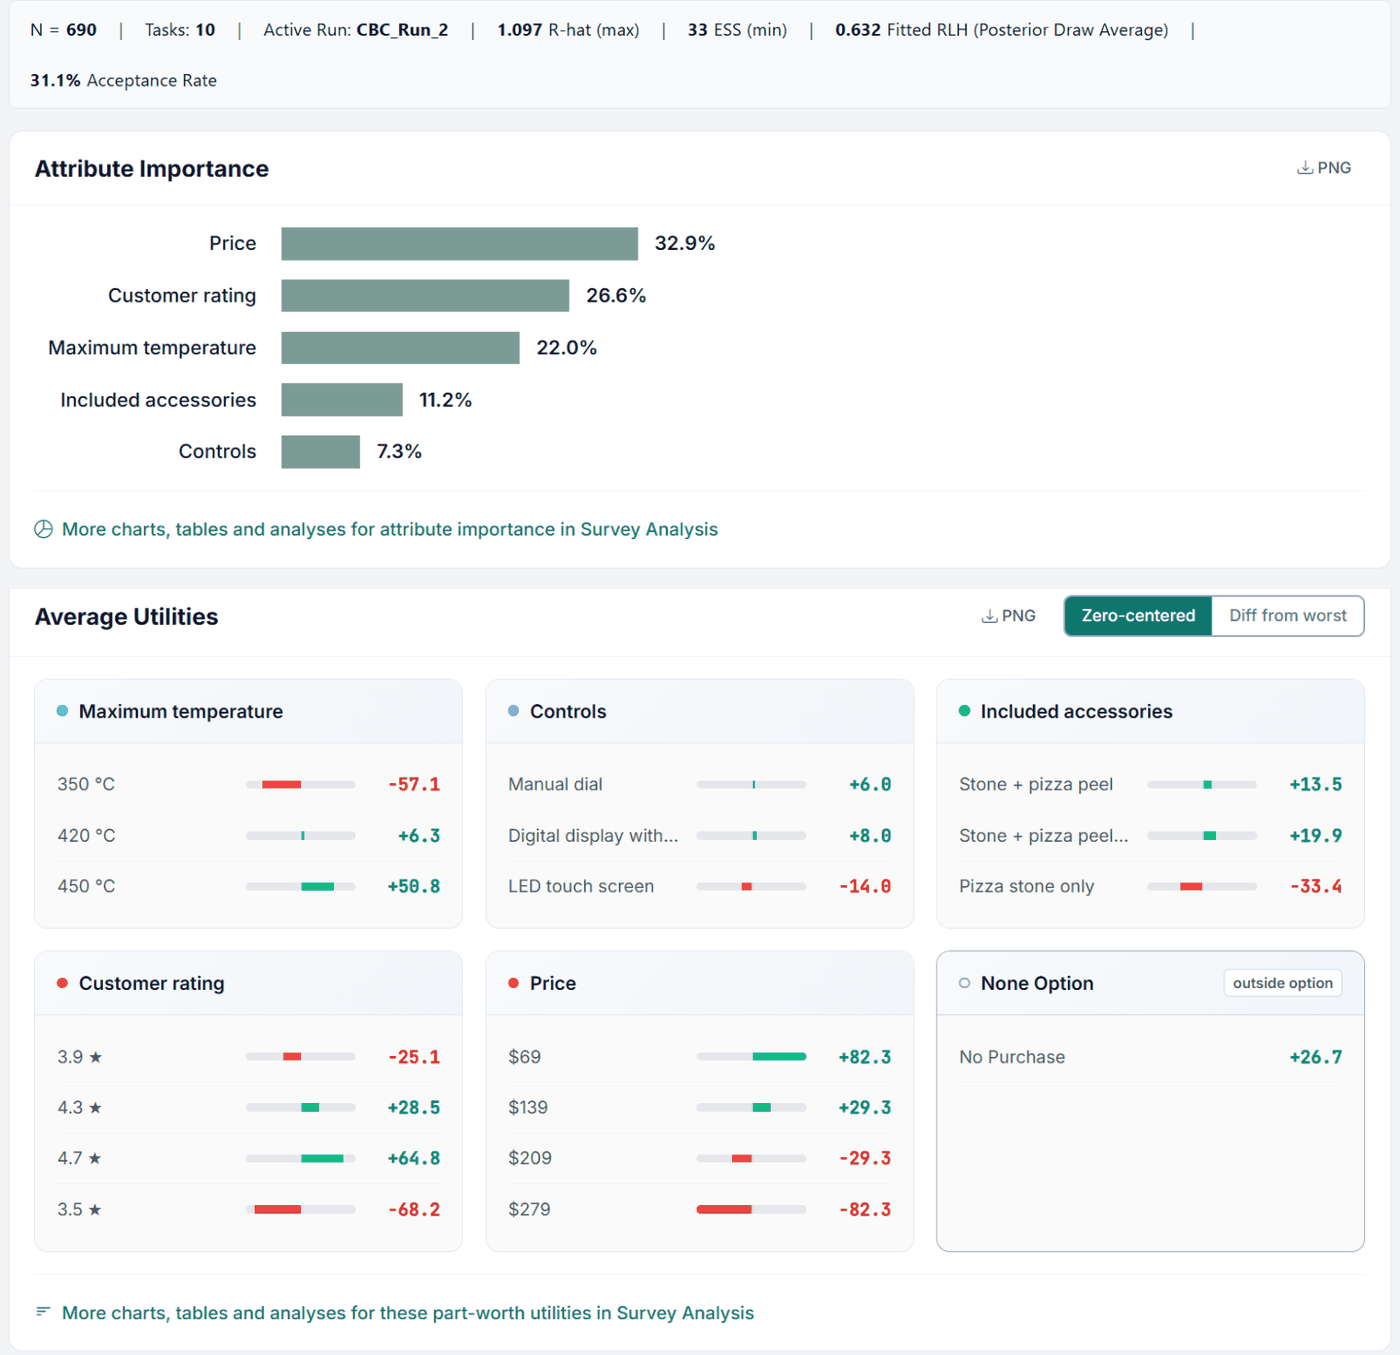
Figure 18. The Results step of run CBC_Run_2 of the pizza oven task (30,000 burn-in, 30,000 draws per chain, N = 690): summary bar, Attribute Importance and Average Utilities (zero-centered) with the None Option card.
Convergence first
The summary bar shows N, the tasks used, the active run, R-hat (max), ESS (min), the Fitted RLH and the acceptance rate. R-hat should be at or below 1.10 and ESS well above 100; the RLH should clearly exceed chance (1 divided by the number of choices). The run in Figure 18 used 30,000 burn-in iterations and 30,000 draws per chain. Its R-hat (max) of 1.097 is just below 1.10, but its ESS (min) of 33 is still far below 100, so a report would need even more draws. The same task with 5,000 / 5,000 ended at R-hat 1.326 and ESS 5. The HB guide explains what to change.
Attribute importances
Importance is the range (best minus worst level) of an attribute's utilities, divided by the sum of all ranges, per respondent and then averaged. In the example run Price leads with 32.9 %, followed by Customer rating (26.6 %), Maximum temperature (22.0 %), Included accessories (11.2 %) and Controls (7.3 %). Importance depends on the level ranges you chose: a wider price range raises price importance.
Part-worth utilities
The Average Utilities cards show one card per attribute, switchable between Zero-centered and Diff from worst. Zero-centered utilities sum to zero within an attribute: positive means above the attribute average. Compare utilities within an attribute, not across attributes. In the example Price is categorical, so each price has its own value ($69 +82.3 down to $279 −82.3). With Price coded as Linear, the card shows one coefficient per unit instead of one value per level. The None Option card shows the utility of choosing nothing (+26.7 in the example).
Keep attributes independent and levels realistic. Every combination the design produces must be plausible.
Stay within about 6 to 8 attributes and 2 to 5 levels, and balance the level counts.
Use 8 to 12 random tasks and 3 to 5 concepts.
Plan at least 300 respondents (200 per reported subgroup) and check the n x t x a / c rule.
Add more than one fixed task as holdout and spread their positions.
Check the Design Diagnostics and the Preview on a phone before fielding.
Check R-hat, ESS and RLH before reporting anything.
Do not
Do not mix two ideas in one attribute (for example a feature and a brand).
Do not add prohibitions for combinations that are merely unusual.
Do not read part-worths across attributes directly; use importances or simulations.
Do not ignore a low RLH; it usually means inattentive respondents or a confusing task.
Part II
Theoretical Background
The random utility model, the logit choice rule, and Hierarchical Bayes estimation.
18. Key Definitions
Attribute and level
An attribute is a feature that varies (Price); a level is one of its values ($139). A profile (concept) is one level per attribute.
Part-worth utility
The contribution of a level to the overall attractiveness (utility) of a profile. Estimated per respondent.
Random utility
The assumption that a respondent's utility for a profile has a systematic part (the part-worths) plus a random error, and they choose the profile with the highest total utility.
Hierarchical Bayes (HB)
An estimation method that models each respondent's utilities as drawn from a population distribution, so individual estimates borrow strength from the group.
Importance
The share of choice variation an attribute explains, computed from the range of its part-worths.
RLH (root likelihood)
Geometric mean of the predicted probabilities of the chosen alternatives; a fit measure. Chance level is one over the number of choices.
19. The Random Utility Model & Logit
CBC rests on random utility theory (McFadden, 1974). Respondent h assigns to profile j a utility that is the sum of the part-worths of its levels plus a random error:
Uhj = Xj′ βh + εhj
Utility of profile j for respondent h; Xj codes the levels, βh is the respondent's part-worths.
If the errors follow an independent extreme-value (Gumbel) distribution, the probability that respondent h chooses profile j from a set has the multinomial logit form:
P(choice = j | βh) = exp(Xj′ βh) / Σk exp(Xk′ βh)
Multinomial logit choice probability. The chosen alternative is compared against all alternatives in the set, including None when it is shown.
This is the choice likelihood that underlies every CBC-family estimator. What differs between CBC, DR-CBC, Best-Worst CBC and MaxDiff is only how observations are constructed and stacked before this same logit is applied.
20. Hierarchical Bayes Estimation
Rather than estimate one average model (aggregate logit), HB estimates individual part-worths and a population distribution that ties them together (Lenk, DeSarbo, Green, & Young, 1996; Rossi, Allenby, & McCulloch, 2005). The model has two levels:
Individual part-worths are drawn from a population normal. p is the number of parameters; V0 is the effects-coded prior covariance built from the Prior σ² setting (default 4.0). The mean prior is diffuse and not user-settable.
Choicery draws from the posterior with a Gibbs sampler that alternates three steps per iteration: a Metropolis-Hastings update of each respondent's βh (proposals shaped by the current covariance Σ), a Gibbs draw of the population mean μ, and a Gibbs draw of Σ from its Inverse-Wishart posterior. During burn-in the proposal step size is adapted every 100 iterations toward the target acceptance rate (default 0.3). The HB guide covers the sampler in detail.
Why HB instead of one aggregate model?
A single aggregate logit hides heterogeneity: if half the market is price-sensitive and half is not, the average looks moderately price-sensitive and describes nobody. HB recovers a price sensitivity for each person, which is what a realistic market simulation needs.
Aggregate logit: one β for everyone.
HB: one β_h per respondent, drawn from MVN(μ, Σ).
Simulation of a niche product only works with the individual β_h.
Convergence diagnostics
R-hat below 1.05 (good) or 1.1 (acceptable) signals that independent chains agree. Effective sample size above 100 supports point estimates; above 400 is comfortable for intervals. If either is weak, use at least two chains, inspect the acceptance rate, and reallocate burn-in versus post-burn-in draws; more burn-in is not an automatic remedy.
Levels enter the model through effects coding. For an attribute with L levels, L minus 1 indicator columns are used and the last level is the negative sum of the others, so the part-worths of an attribute always sum to zero:
Effects coding. The reference level is the negative sum, so Σ utilities = 0 within the attribute.
Raw utilities are on the model's logit scale and their absolute size depends on response consistency, so they are not comparable across respondents or studies. Zero-centered diffs (ZC) rescale each respondent so that the average attribute range equals 100:
ZCi = Rawi × (100 / average attribute range)
Zero-centered-diff rescaling. After this, an attribute range of 100 is "average importance".
Importance of an attribute is its utility range divided by the sum of all ranges, expressed as a percentage:
Attribute importance. Computed per respondent, then averaged.
Because importances are computed per respondent and then averaged, they reflect that different people weight attributes differently, which an aggregate model would miss.
22. Experimental Design
A good CBC design lets the logit separate the part-worths cleanly. Two properties matter: level balance (each level appears about equally often) and orthogonality (levels of different attributes are as uncorrelated as possible). Choicery generates designs with a balanced-overlap heuristic by default, which balances levels and level pairs and allows a moderate amount of level repetition within a task. D-optimal and random generators are also available; the random generator does not optimize. Multiple versions spread the design across respondents so no single person carries the whole burden.
Why not a full factorial?
The pizza oven task has 3 x 3 x 3 x 4 x 4 = 432 possible profiles. Showing them all is impossible, so CBC uses a fraction of them that still identifies every part-worth. The design is the reason ten tasks per respondent can estimate a model with many parameters.
23. References
Clayton, K., Horiuchi, Y., Kaufman, A. R., King, G., & Komisarchik, M. (2026). Correcting measurement error bias in conjoint survey experiments (version of July 27, 2026; American Journal of Political Science replication version). GaryKing.org/conjointE.
Goeken, N., Kurz, P., & Steiner, W. J. (2024). Multimodal preference heterogeneity in choice-based conjoint analysis: A simulation study. Journal of Business Economics, 94, 137-185.
Green, P. E., & Rao, V. R. (1971). Conjoint measurement for quantifying judgmental data. Journal of Marketing Research, 8(3), 355-363.
Green, P. E., & Srinivasan, V. (1990). Conjoint analysis in marketing: New developments with implications for research and practice. Journal of Marketing, 54(4), 3-19.
Hung, C.-Y., Kurz, P., Bailey, R. A., Huber, J., & Allenby, G. M. (2025). Re-examining the no-choice option in conjoint analysis. Journal of Choice Modelling, 57, 100578.
Hung, C.-Y., Liu, Y. M., Brazell, J. D., & Allenby, G. M. (2025). Dual response in conjoint analysis. Marketing Letters, 36, 857-873.
Lenk, P. J., DeSarbo, W. S., Green, P. E., & Young, M. R. (1996). Hierarchical Bayes conjoint analysis: Recovery of partworth heterogeneity from reduced experimental designs. Marketing Science, 15(2), 173-191.
Louviere, J. J., Hensher, D. A., & Swait, J. D. (2000). Stated choice methods: Analysis and applications. Cambridge: Cambridge University Press.
Mao, Y., Kessels, R., & Mee, R. (2025). Beyond randomization: Design and analysis of discrete choice experiments in the presence of profile order effects within choice sets. Applied Stochastic Models in Business and Industry, 41, e70043.
McFadden, D. (1974). Conditional logit analysis of qualitative choice behavior. In P. Zarembka (Ed.), Frontiers in econometrics (pp. 105-142). New York: Academic Press.
Orme, B. K. (2020). Getting started with conjoint analysis: Strategies for product design and pricing research (4th ed.). Manhattan Beach, CA: Research Publishers.
Orme, B. K., & Chrzan, K. (2017). Becoming an expert in conjoint analysis: Choice modeling for pros. Provo, UT: Sawtooth Software.
Rao, V. R. (2026). Applied conjoint analysis: From product and service design to market and pricing strategies (2nd ed.). Cham: Springer. (Chapter 16 is written by B. Orme.)
Rossi, P. E., Allenby, G. M., & McCulloch, R. (2005). Bayesian statistics and marketing. Chichester: John Wiley & Sons.
Sablotny-Wackershauser, V., Lichters, M., Guhl, D., Bengart, P., & Vogt, B. (2024). Crossing incentive alignment and adaptive designs in choice-based conjoint: A fruitful endeavor. Web Appendices.
Train, K. E. (2009). Discrete choice methods with simulation (2nd ed.). Cambridge: Cambridge University Press.