The manual for the DR-CBC editor: every step and setting, the Integrated and Two-Block modes, how large the study should be, and how Choicery turns the buy / no-buy answer into a None utility. Worked example: the pizza delivery task of the Pizza (Example) study.
How to build, field, and analyse a Dual-Response Choice-Based Conjoint study in Choicery.
1. What Is DR-CBC?
Dual-Response CBC (DR-CBC) is standard Choice-Based Conjoint with one extra question per task. First the respondent makes the usual forced choice: they see a small set of product profiles and pick the one they prefer most. Then they answer a follow-up question about that profile: would you actually buy it? Yes or No. The second answer is what makes the method "dual response".
The follow-up recovers something a forced choice throws away. In traditional CBC every respondent must pick a profile, even one they would never buy, so the data only show relative preference. The "No" answers in DR-CBC create a real no-purchase outcome. From them Choicery estimates a None utility (a no-purchase threshold) next to the part-worths, so you can talk about category demand and not only about who wins a forced choice.
The Pizza example used throughout this guide
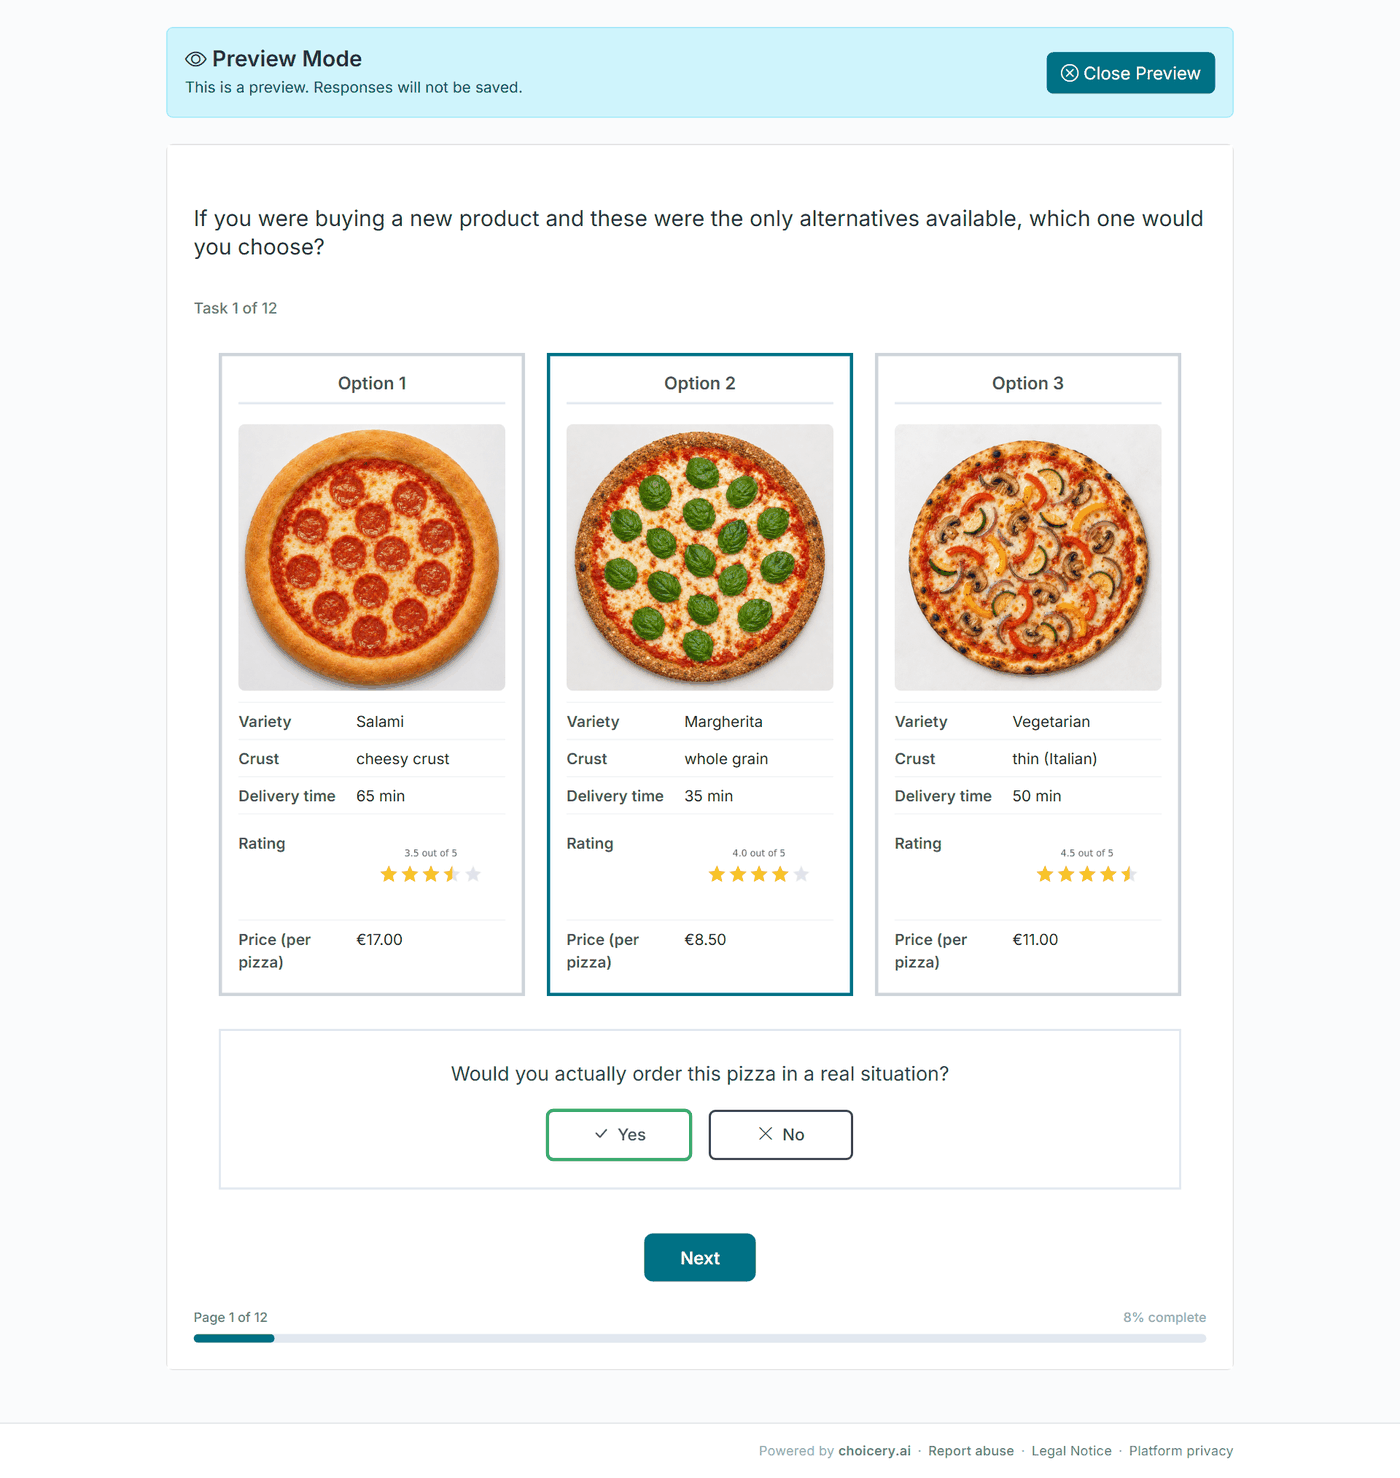
The Pizza (Example) study contains a DR-CBC task about pizza delivery with five attributes: Variety (Margherita, Salami, Vegetarian), Crust (thin (Italian), whole grain, cheesy crust), Delivery time (20, 35, 50, 65 min), Rating (3.5, 4.0, 4.5, 4.9 ★) and Price (per pizza) (€8.50, €11.00, €14.00, €17.00). Respondents see three pizzas, pick one, and then answer "Would you actually order this pizza in a real situation?". All screenshots below come from this study.
What you get out of it
Everything traditional CBC gives you: individual part-worth utilities, attribute importances, and a market simulator.
A None utility: the appeal of not buying at all, on the same scale as the products.
A no-buy share in the simulator: what fraction of the market would walk away from a given set of offers.
More information per task: the forced choice is kept even when the answer is No, so no preference information is lost.
2. When to Use It (and When Not)
Use DR-CBC whenever "would anyone buy this at all?" is a real question, not only "which of these would they pick?". That covers new products, pricing studies where walking away is a real option, and any study that has to size demand rather than only split it.
Situation
Use
You need "would you buy at all?" (a real None, category demand)
DR-CBC (dual response)
Standard "pick one of several products", with or without a None column
CBC Traditional
You want extra information per task (best and worst)
Best-Worst CBC
A shop or shelf presentation matters
CBC Shop
Many single items (features, messages), no product profiles
MaxDiff
Orme and Chrzan (2017, ch. 5 "Dual-Response None") compare the standard None column with the dual-response None and conclude: "We tend to favor the dual-response None." The reason: with a standard None, a respondent who picks None tells you nothing about the products shown; with heavy None use the effective sample shrinks (their example: over 80% None left about one fifth of the data). The dual-response format keeps the forced choice, so every task carries product information, and it lengthens the interview without doubling it. If every respondent will certainly buy something (a captive audience), the follow-up adds little and plain CBC is simpler.
3. Opening the Editor
Open the Survey Flow editor of your project. In the palette on the left, section Conjoint, click (or drag) DR-CBC. Choicery creates a draft and opens the DR-CBC Design Configuration on the General step. The task joins the survey flow once you save the draft. To change an existing DR-CBC task, click Edit (gear icon) on its card in the flow, or click its row in the list view.
Each action (add, edit, delete, upload) is saved at once.
Generate
The design is saved when generation finishes.
Locks
Two locks protect a study once it is in use.
A design exists. The Attributes step shows "Attributes are locked. Delete the generated design before changing attributes or levels. Your existing configuration will be kept." with the button Delete generated design to edit attributes. Prohibitions are locked in the same way: "Prohibitions are locked because a generated design exists. Delete the generated design on the Generate tab before changing prohibitions."
Responses exist. A banner "Design locked - responses already collected" appears on every step. It counts the active and trashed responses that "already reference this design" and says: "To modify the design, open Data → Bin and permanently delete all responses first. To preserve them, duplicate the project before making changes. Preview, downloads, and design diagnostics remain available while the design is locked." The attribute lock then reads "Responses already reference this generated design. ... duplicate the project before making structural changes."
Above all steps the editor can also show "Design Warning: ..." when the generated design no longer matches the attributes, and "Regeneration required. This generated design conflicts with active prohibitions and cannot be published until it is regenerated."
4. The Required Steps
General
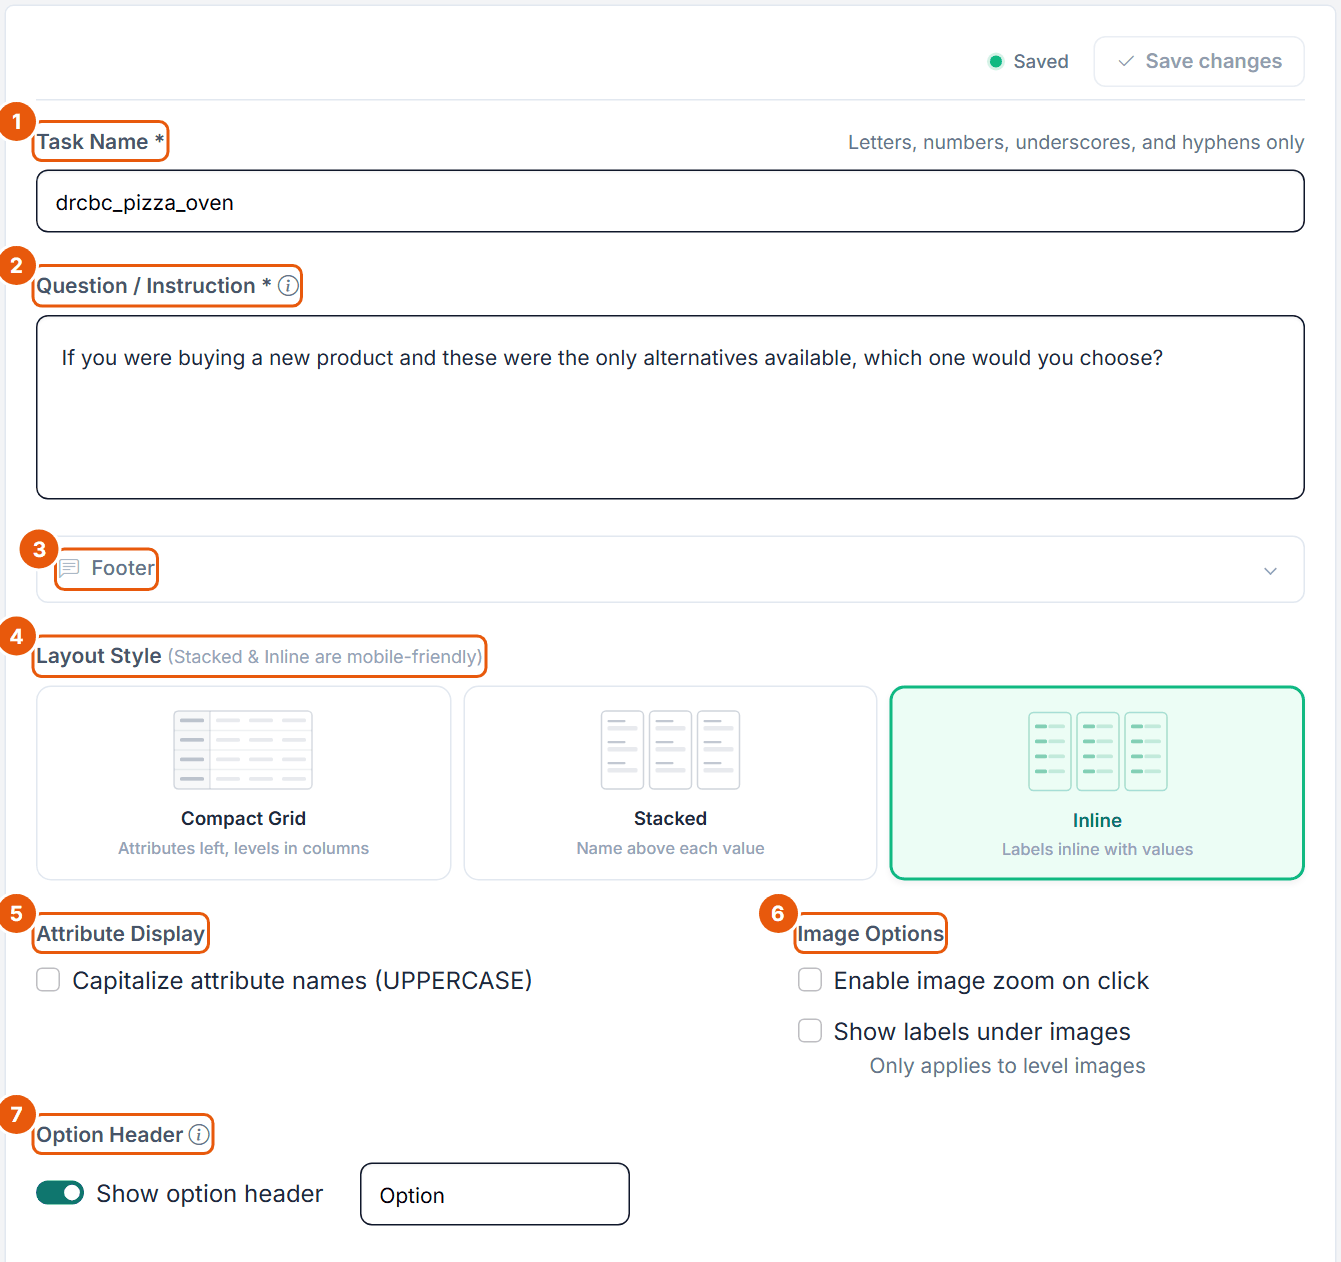
The General step holds the task name, the question above each choice, and how the product cards look. Remember to click Save changes.
Figure 1. The General step of the Pizza DR-CBC task.
No.
Control
What it does
1
Task Name *
Internal name of the task. Letters, numbers, underscores and hyphens only, up to 50 characters, no spaces. Default drcbc_task. It becomes part of the export column names (see the box below).
2
Question / Instruction *
Rich text shown above every choice (in Two-Block mode only above the Block 1 choices). Default: "If you were buying a new product and these were the only alternatives available, which one would you choose?". Up to 10,000 characters and 10 inline images.
3
Footer
Collapsible panel for optional text below the task, for example a note on delivery costs.
4
Layout Style
How each product card lists its attributes: Compact Grid (attributes left, levels in columns), Stacked (name above each value) or Inline (labels inline with values). Default Inline. Stacked and Inline are the mobile-friendly choices.
5
Attribute Display
Capitalize attribute names (UPPERCASE). Off by default.
6
Image Options
Enable image zoom on click (opens images in a lightbox) and Show labels under images (only applies to level images). Both off by default.
7
Option Header
Show option header switch (on by default) and the label text (default "Option"). The cards then read "Option 1", "Option 2", ... Up to 100 characters are kept.
Export column names
In the wide data export the columns of a DR-CBC task are named drcbc_<Task Name>_t1, drcbc_<Task Name>_t2, ... for the chosen option (1, 2, 3 = Option 1, 2, 3), and drcbc_<Task Name>_t1_none, ... for the follow-up (1 = Yes, 2 = No). Tasks at a fixed-task position are labelled FIXED_t<n>, for example drcbc_<Task Name>_FIXED_t2. The prefix drcbc_ is always added, so the Pizza task name drcbc_pizza_oven gives drcbc_drcbc_pizza_oven_t1. A short task name without the prefix (for example pizza) keeps the columns readable.
Dual-Response
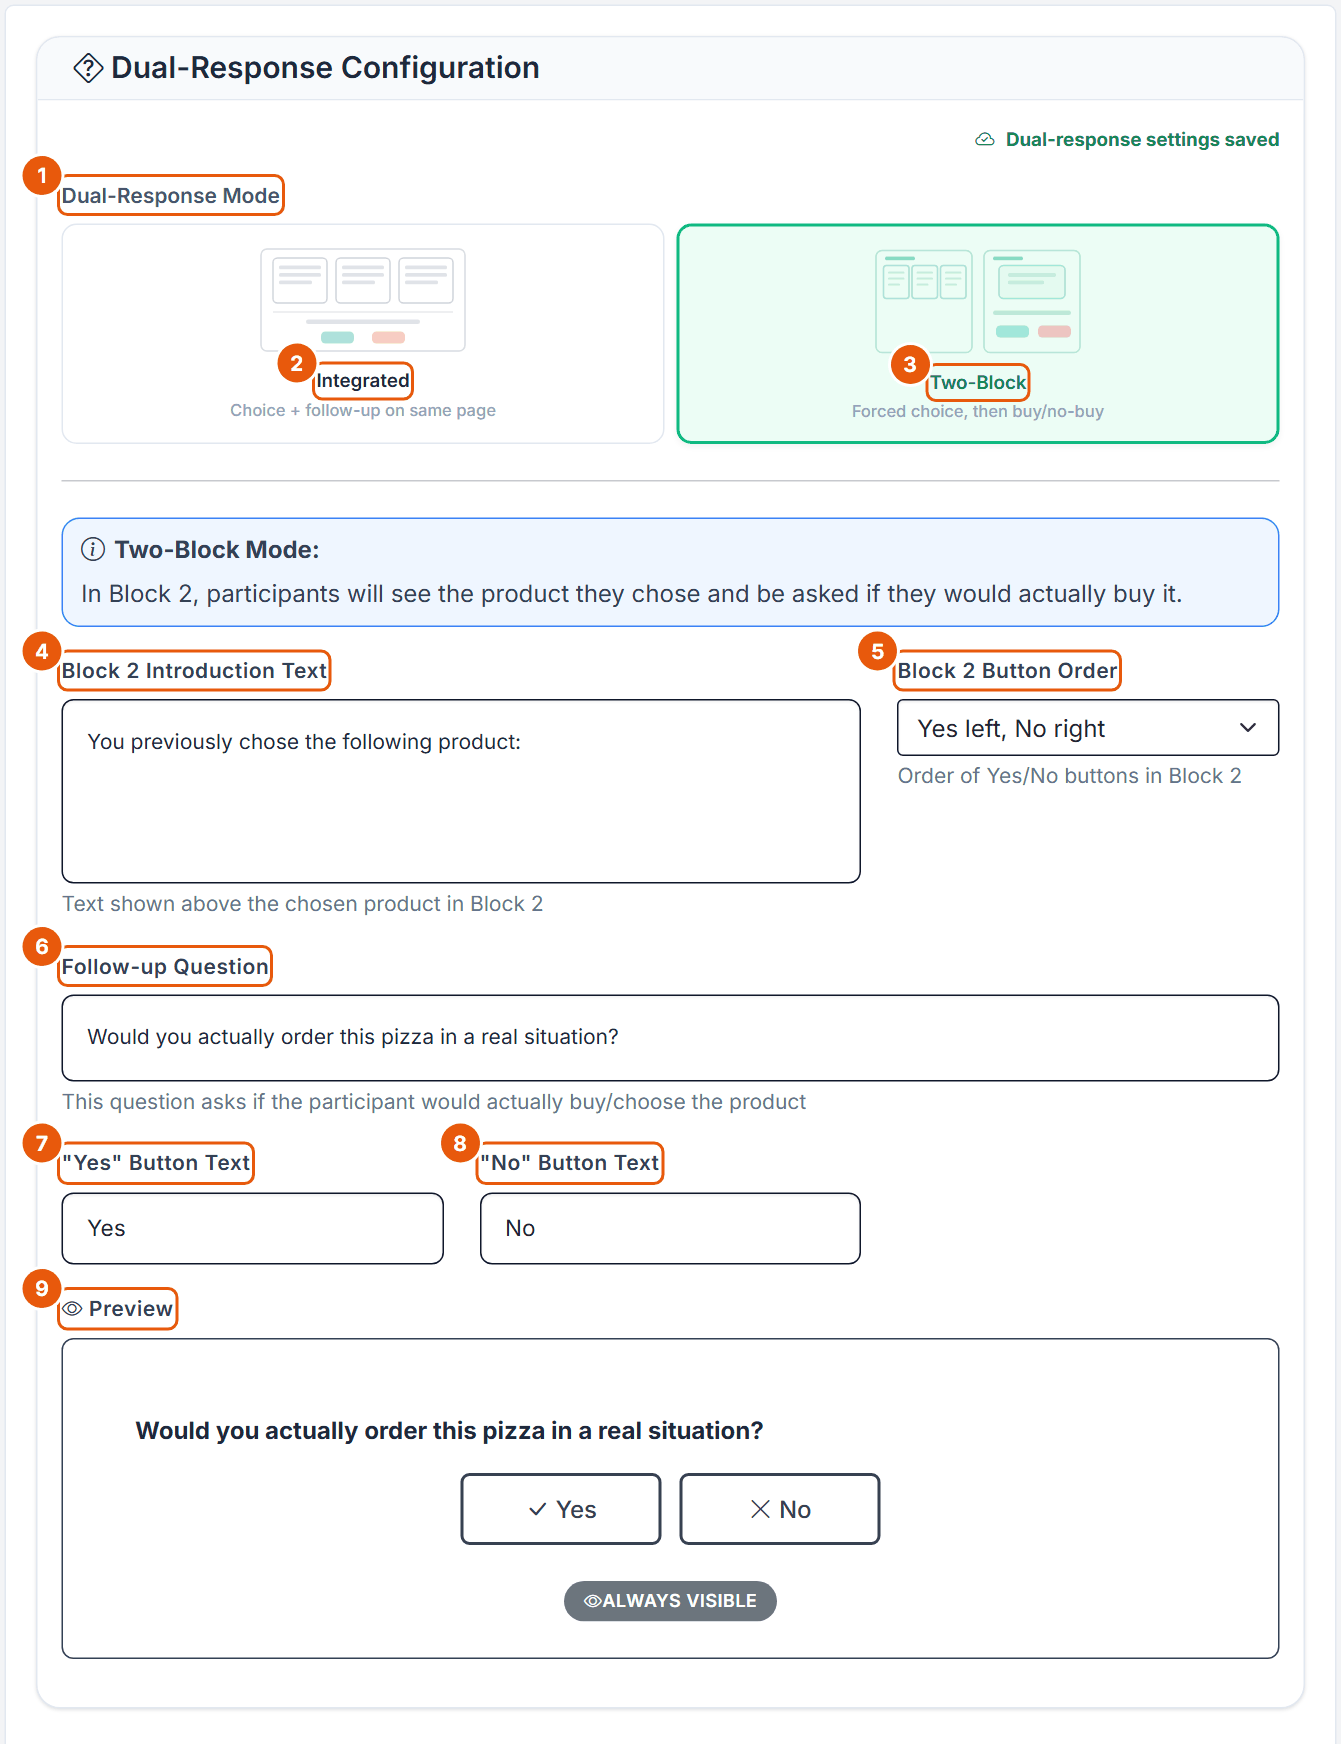
This step defines the follow-up question and how it is shown. It saves automatically. It needs no design columns: the follow-up is always asked about the option the respondent chose.
Figure 2. The Dual-Response step of the Pizza task, set to Two-Block.
No.
Control
What it does
1
Dual-Response Mode
Chooses how the follow-up is presented. Default Integrated. Switching the mode shows or hides the mode-specific settings below.
2
Integrated
"Choice + follow-up on same page". One page per task: the product cards with the follow-up underneath.
3
Two-Block
"Forced choice, then buy/no-buy". The info box explains: "In Block 2, participants will see the product they chose and be asked if they would actually buy it."
4
Block 2 Introduction Text
Two-Block only. Rich text "shown above the chosen product in Block 2". Default "You previously chose the following product:".
5
Block 2 Button Order
Two-Block only. Yes left, No right (default) or No left, Yes right. This is the same stored setting as Integrated Button Order (below): changing one changes the other.
6
Follow-up Question
Required rich text, "This question asks if the participant would actually buy/choose the product". Default "Would you also choose this option in a real situation?". The Pizza study uses "Would you actually order this pizza in a real situation?".
7
"Yes" Button Text
Required, plain text, up to 50 characters. Default "Yes".
8
"No" Button Text
Required, plain text, up to 50 characters. Default "No".
9
Preview
Live preview of the follow-up with your wording, button order and style. The badge shows the question visibility ("Always visible" or "After selection"). You can click Yes or No to see the selected state. It stays usable when the editor is locked.
Advanced Settings (Integrated mode only)
In Integrated mode a collapsed link Advanced Settings appears below the button texts. In Two-Block mode it is hidden.
Setting
Options and default
Effect
Question Visibility
Always visible (default) or Show after option selection
"When the follow-up question appears": at once, or only after a product card is clicked.
Integrated Button Order
Yes left, No right (default) or No left, Yes right
Same setting as Block 2 Button Order.
Button Style
Colored (Green / Red) or Neutral (Black border) (default)
"Visual style of Yes/No buttons".
Green/red border when selected
Switch, shown only for Neutral. On for new tasks (off for tasks saved before the setting existed)
On: the chosen Yes gets a green and the chosen No a red border. "Off: the selected button uses the primary color."
Show icons on buttons
Switch, on by default
"Show ✓ and ✗ before Yes/No".
Expected None Share (Optional)
Empty, or a share from 0 to 1 in steps of 0.01 (0.25 means 25%)
"Proxy metadata for diagnostics; this does not change the generated tasks." It appears in the Efficiency Details of the design diagnostics. A value outside 0 to 1 turns the field red: "Enter a value from 0 to 1."
Settings that are hidden in Two-Block mode but still used
Button Style, Green/red border when selected and Show icons on buttons sit only in the Integrated Advanced Settings. In Two-Block mode they are hidden, but the Block 2 pages still use the saved values. To change them for a Two-Block study, switch to Integrated, change them, and switch back to Two-Block. The same applies to Expected None Share. Question Visibility has no effect in Two-Block mode, because the follow-up has its own page there.
Integrated or Two-Block?
Integrated
Two-Block
Pages per task
1
2 (one in Block 1, one in Block 2)
Order
Choice and follow-up on the same page, task after task
All forced choices first (Block 1), then one follow-up page per task in the same order (Block 2)
What the follow-up page shows
The follow-up box below the cards, with the chosen card highlighted
Block 2 Introduction Text, the chosen product as a single card (headed "Option n" with its original position when the option header is on), the follow-up question and the Yes/No buttons. The Question / Instruction is not repeated.
Every task counts twice. With the Pizza design (10 random + 2 fixed tasks) the task has 24 pages instead of 12. The Tasks value on the Generate step is per block.
What the literature says. The digest of sources behind this guide contains no study that compares these two presentations directly, so the choice is a judgement call.
Hung, Liu, Brazell and Allenby (2025, p. 863) asked the follow-up "Would you purchase the preferred TV selected above?" right after each choice (6 concepts, 15 tasks, n = 310), which matches the Integrated layout. They argue that the follow-up "helps respondents feel less pressure to say 'no'", because they have already been helpful in the first answer, and that it "slows their pace and encourages them to think carefully about whether it fits within their budget" (p. 858).
Their results: respondents applied a budget constraint in the second answer but not in the first, so the first answer shows preference and the second affordability (p. 857, p. 868). Modelled jointly, dual-response data improved estimation efficiency by about 30% over collapsing to one response, and 10 dual-response tasks already beat 15 single-response tasks (pp. 865-867).
Orme and Chrzan (2017, ch. 5) describe variants: a five-point purchase-intent follow-up, the "reversed" dual response ("buy any?" first, with more realistic None rates), and the "separated" dual response of Schlereth and Skiera, in which buy/no-buy is asked on a separate, representative set of about six concepts. Choicery's Two-Block mode is related to the separated form (choices first, purchase questions later) but asks about each chosen product, not about a separate set.
Dual response raises how often None is chosen, but relative shares and part-worths stay essentially unchanged (Hung et al., 2025, p. 858, citing Brazell et al., 2006).
In practice: Integrated is shorter and is the format used in the studies above. Two-Block keeps the forced choices free of the purchase question, at the cost of twice the pages and a less natural flow. The estimation is identical for both.
Attributes
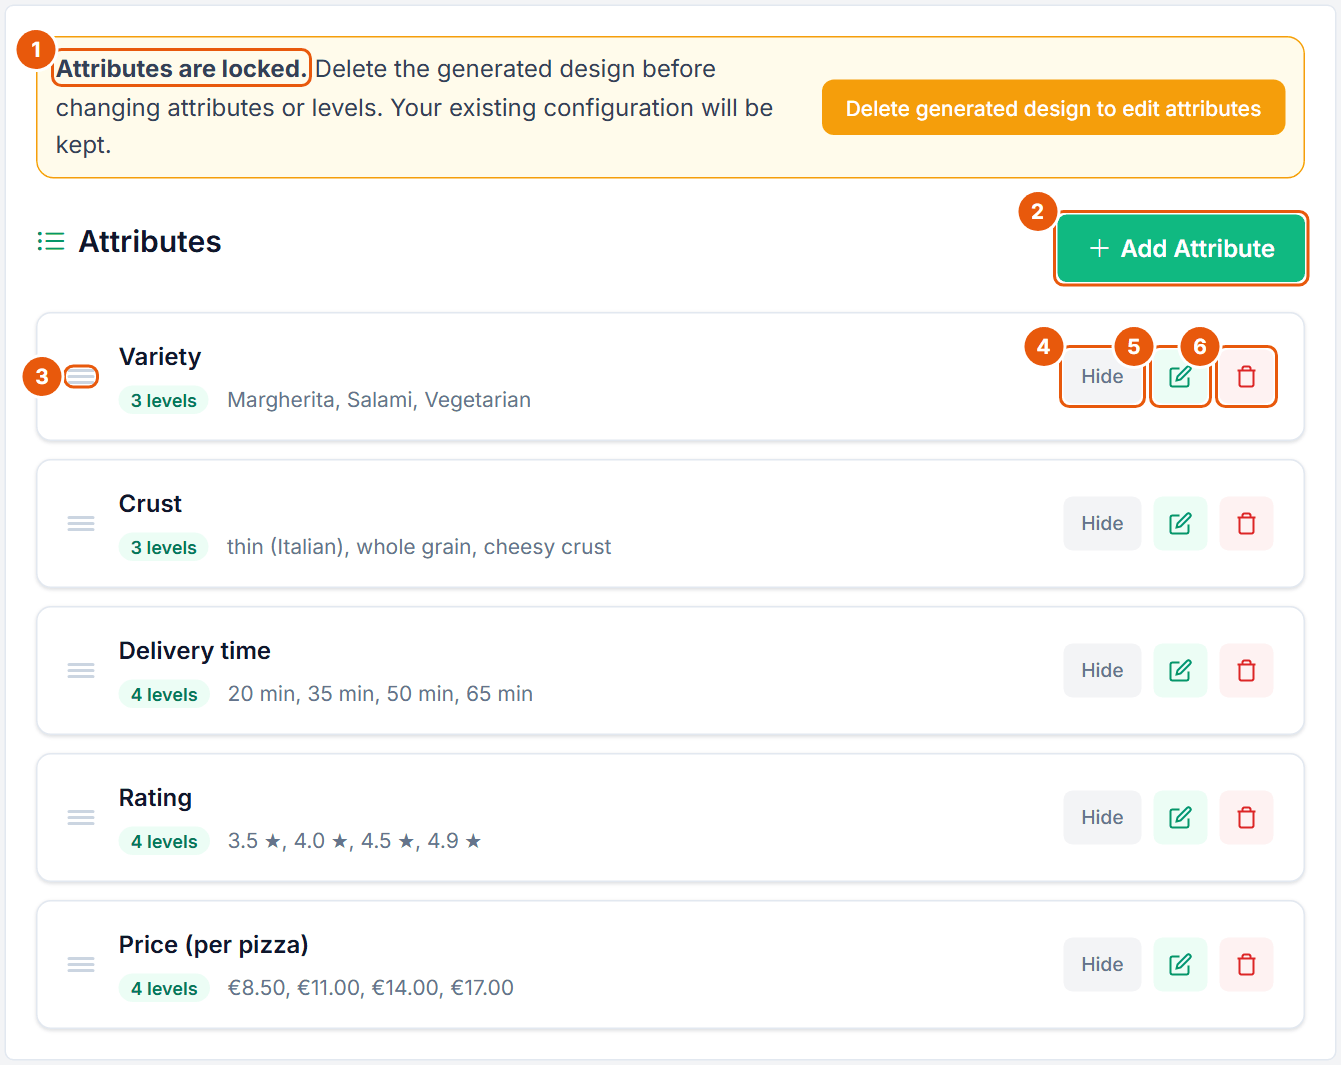
The Attributes step lists the attributes and their levels. Every action saves at once.
Figure 3. The Attributes step of the Pizza task. A design exists, so the attributes are locked.
No.
Control
What it does
1
Attributes are locked.
Shown once a design exists. Delete generated design to edit attributes removes the design and keeps all settings; the design size and method return to their defaults. With responses the design cannot be deleted.
2
Add Attribute
Opens the Add Attribute dialog (Figure 4).
3
Drag handle
"Drag to reorder". The order here is the order of the rows on the product cards.
4
Hide / Show
"Hidden attributes are still part of the design but won't be displayed in the survey. Useful when Product Images already show the attribute visually." Choicery asks for confirmation first.
5
Edit
Opens the attribute in the same dialog. With a design present, a change shows "Design exists but attributes have changed. Please regenerate your design."
6
Delete
"Delete attribute "<name>"? This cannot be undone."
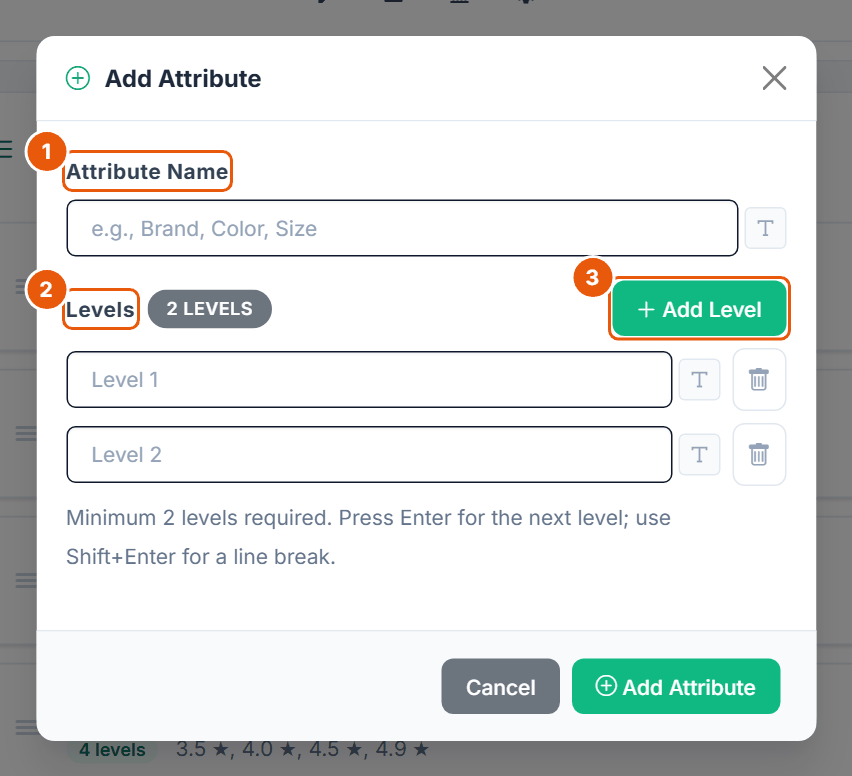
Figure 4. The Add Attribute dialog.
No.
Control
What it does
1
Attribute Name
Up to 50 characters. The T button next to the field opens text formatting (no images). Names that equal technical column names in Choicery data files are rejected, and two attributes cannot share a name (ignoring capitalization).
2
Levels
One field per level, up to 50 characters each, with a level counter. Press Enter for the next level, Shift+Enter for a line break. At least 2 levels; duplicates (ignoring capitalization) are not allowed. From 16 levels the counter turns amber: "This attribute is approaching the limit of 20 levels."
3
Add Level
Adds another level field. Pictures for levels are added on the Level Images step.
Limit
Editor (all plans)
Free
Attributes per task
up to 20
4
Levels per attribute
2 to 20
4
Attribute and level name length
50 characters
50 characters
The editor allows far more than the literature recommends; see Section 7. The Pizza task uses 5 attributes with 3 or 4 levels each.
5. The Optional Steps
Fixed Tasks
Fixed tasks are the same for every respondent. Choicery uses them as holdouts: they are excluded from the HB estimation and serve to check how well the model predicts choices.
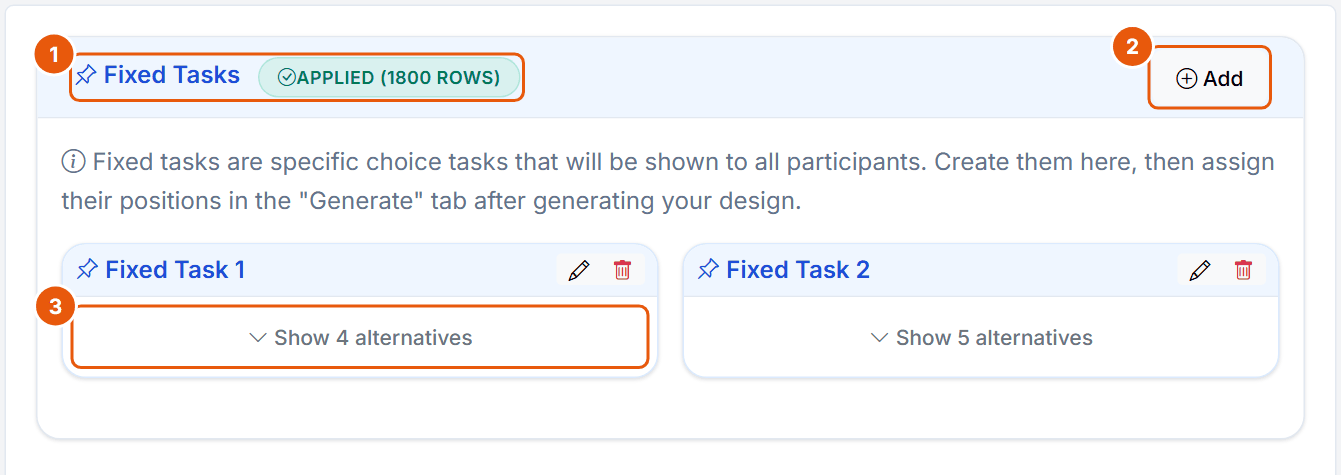
Figure 5. The Fixed Tasks step of the Pizza task with two fixed tasks.
No.
Control
What it does
1
Fixed Tasks + state badge
The badge shows whether the fixed tasks are in the design, for example "APPLIED (1800 ROWS)". Without fixed tasks a warning explains that you cannot calculate hit rates.
2
Add
Opens the Create Fixed Task dialog (Figure 6).
3
Show n alternatives
Expands the alternatives of a fixed task. The pencil and bin icons edit or delete it. Fixed tasks may have more or fewer alternatives than the random tasks (here 4 and 5 against 3 concepts).
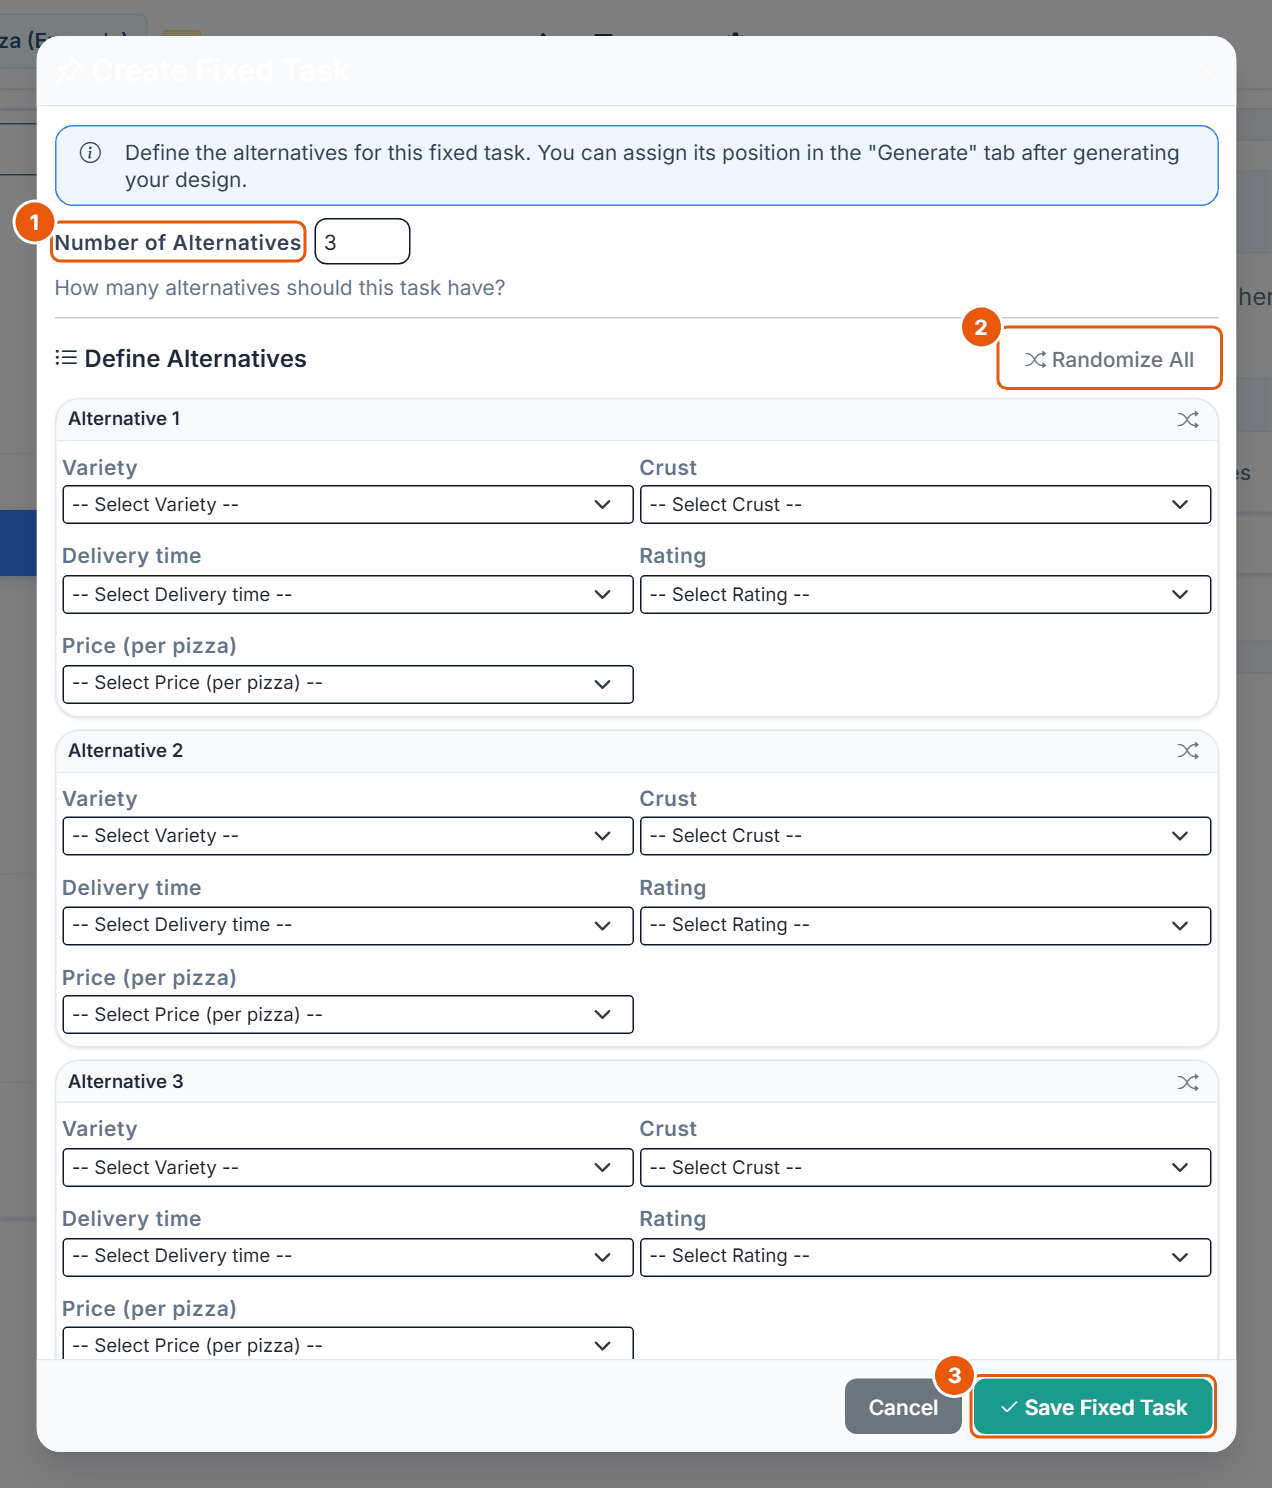
Figure 6. The Create Fixed Task dialog.
No.
Control
What it does
1
Number of Alternatives
2 to 9, default 3. One block of level selects per alternative appears below.
2
Randomize All
Fills all selects at random. The shuffle icon on each alternative randomizes only that one.
3
Save Fixed Task
Saves the task. Every level must be chosen ("Please select all levels for Alternative N"), and alternatives that violate a prohibition are rejected. Up to 20 fixed tasks per task.
You place the fixed tasks after generating the design, under Fixed Task Positions on the Generate step (Figure 14).
Product Images
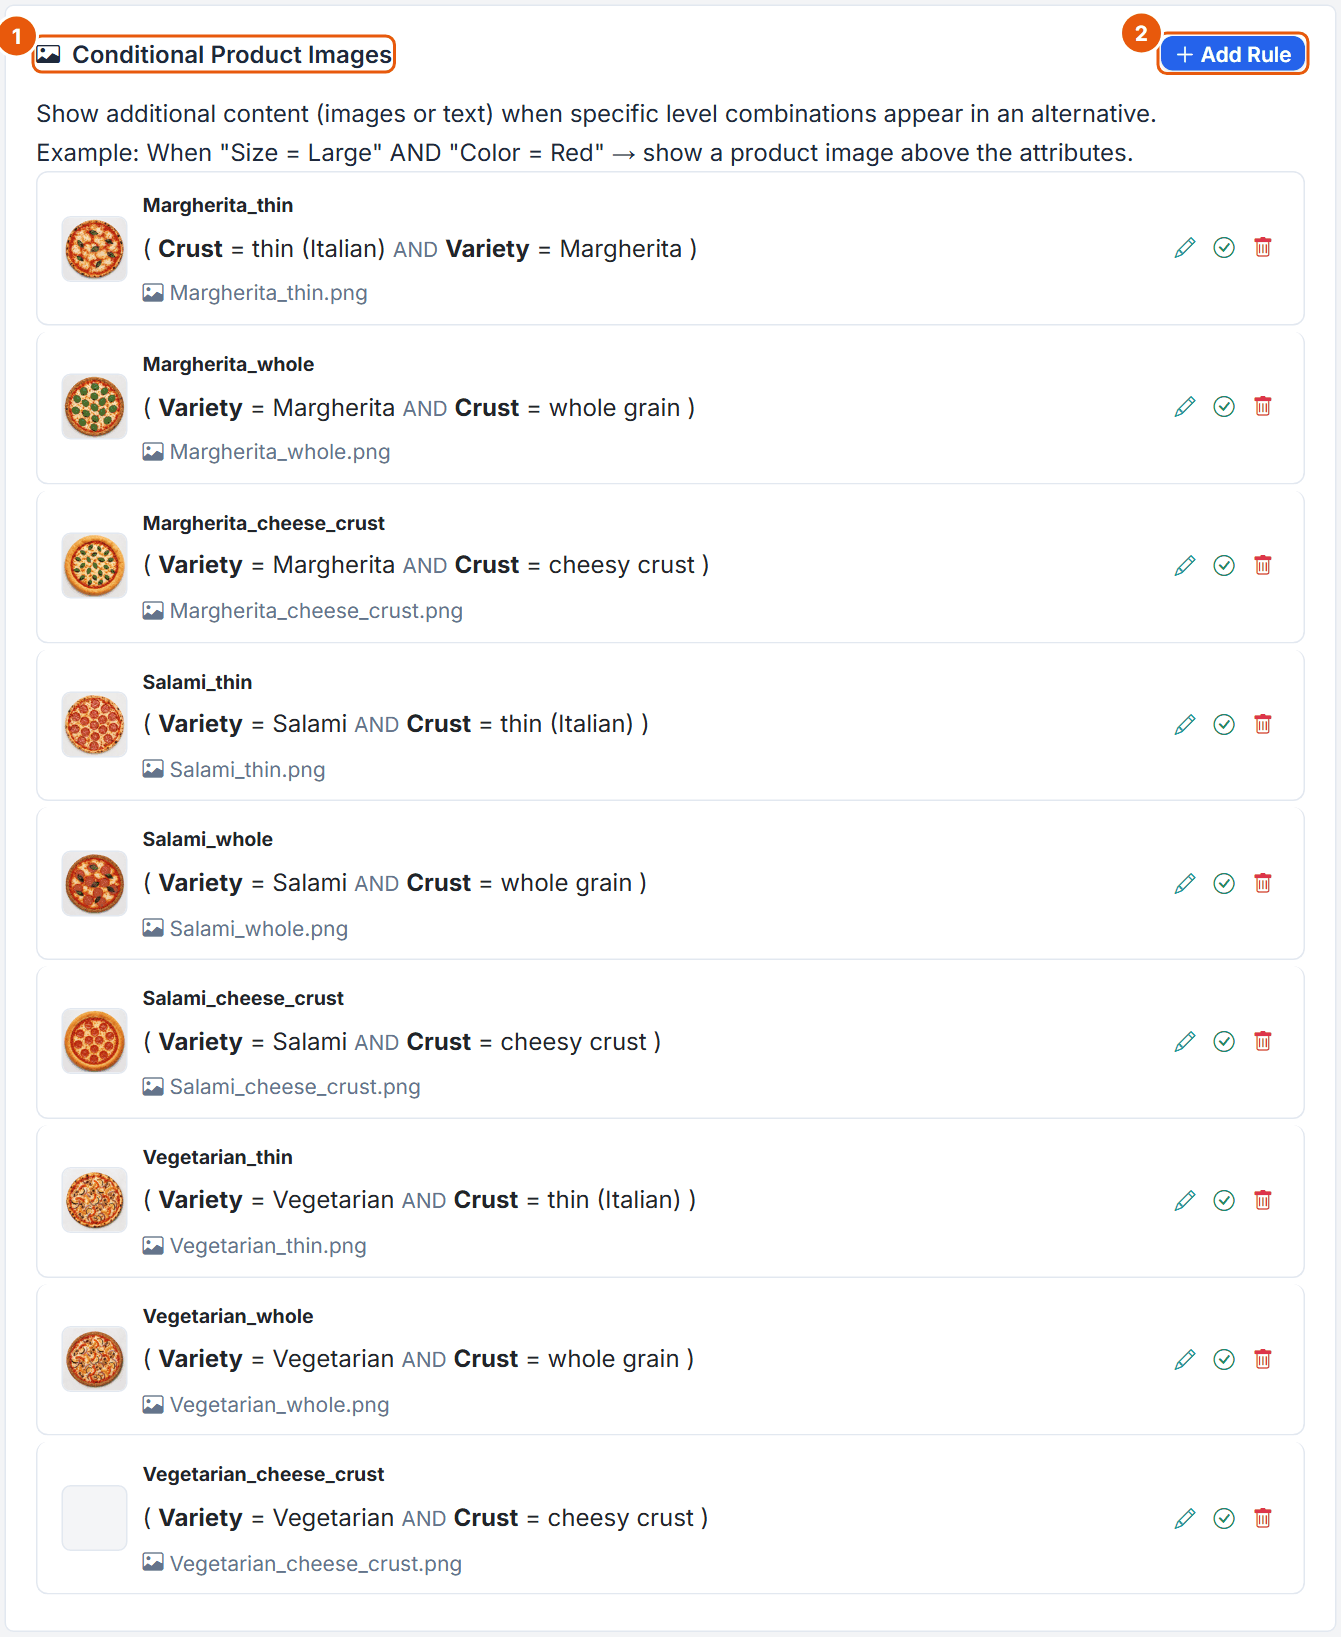
Product images show a picture (or a text) above the attributes when a given combination of levels appears in a product. The Pizza study uses nine rules, one per Variety and Crust combination.
Figure 7. The Product Images step of the Pizza task.
No.
Control
What it does
1
Conditional Product Images
The list of rules. Each row shows the rule name, its conditions and the image. The icons on the right edit a rule, switch it on or off, and delete it.
2
Add Rule
Opens the Add Product Image dialog (Figure 8). Up to 30 rules.
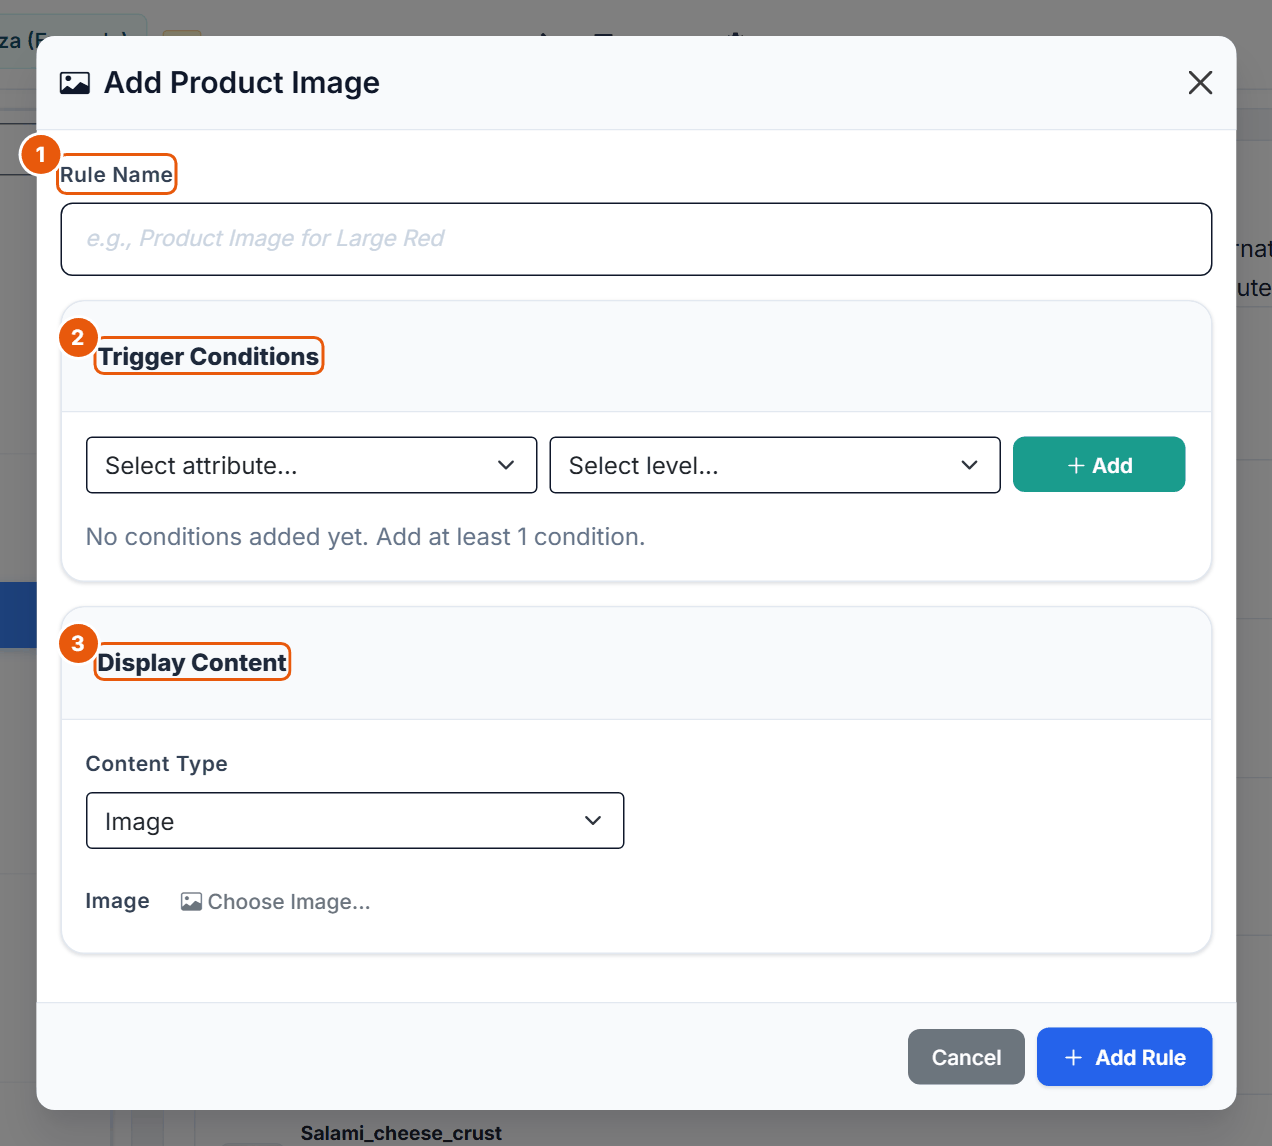
Figure 8. The Add Product Image dialog.
No.
Control
What it does
1
Rule Name
Required, up to 80 characters.
2
Trigger Conditions
Pick an attribute and a level, then + Add. Conditions can be combined in AND and OR groups; an attribute can appear only once per AND group. At least one condition.
3
Display Content
Content Type Image (with Choose Image...) or Text (up to 1,000 characters). For images, Max Height Ratio (default 1, 0.5 to 3) limits the height relative to the card width: 1 = square, 0.5 = landscape, 2 = tall portrait. The content always appears at the top of the card.
Level Images
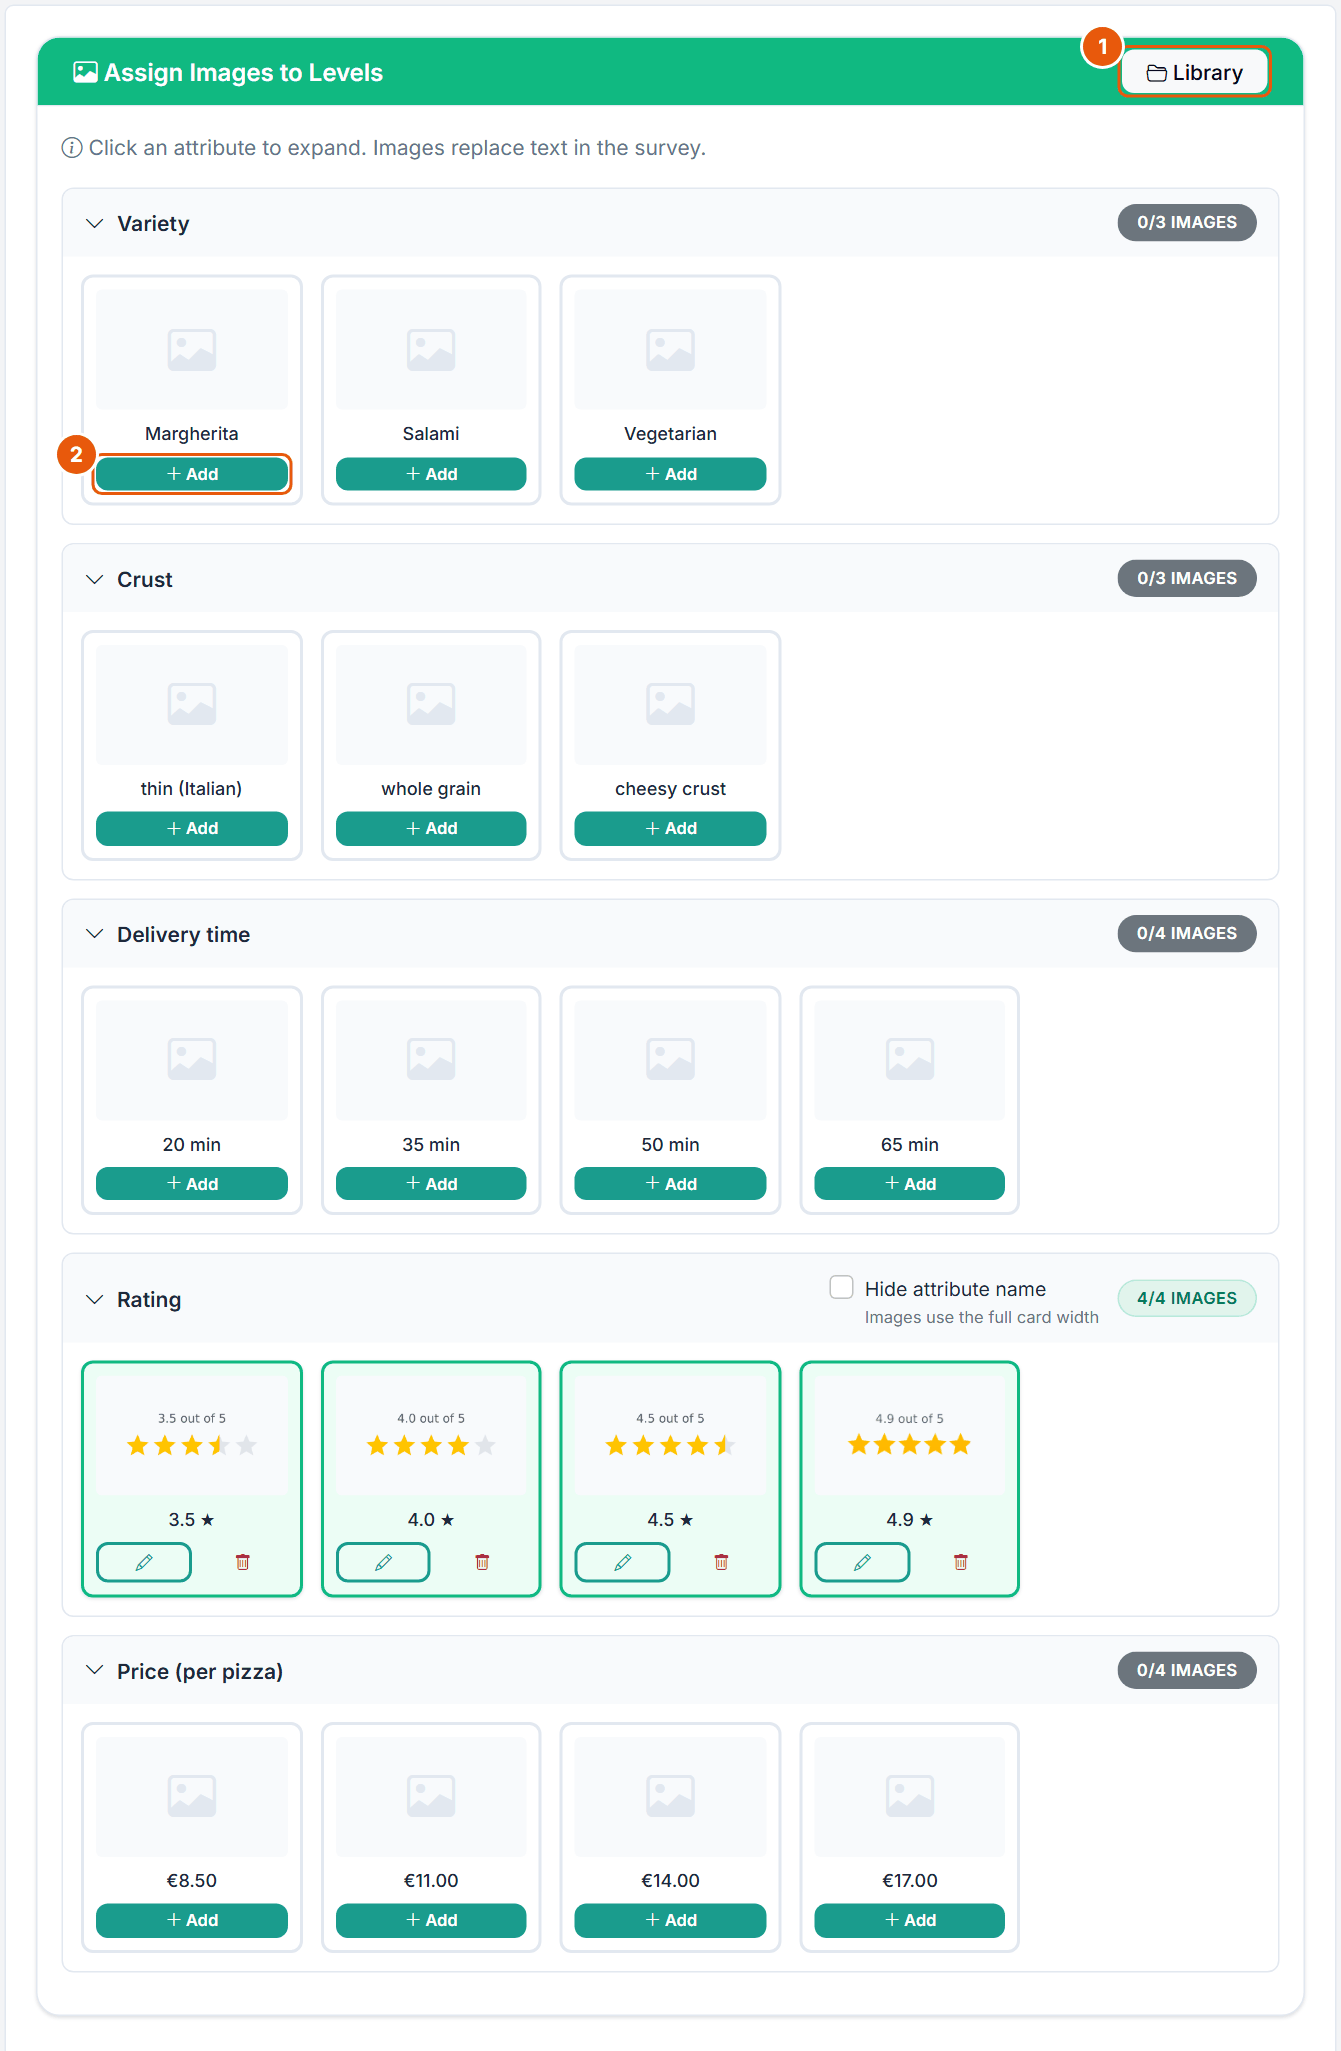
Level images replace the text of a level with a picture, for example star graphics for the ratings.
Figure 9. The Level Images step of the Pizza task. The Rating levels use star images.
No.
Control
What it does
1
Library
Opens the image library of the project.
2
Add
Uploads or picks an image for this level (png, jpg, jpeg, gif or webp, up to 5 MB). Once an image is set, the pencil changes it and the bin removes it. The badge per attribute counts the images ("4/4 IMAGES"). As soon as an attribute has an image, the switch Hide attribute name appears: "Images use the full card width".
Prohibitions
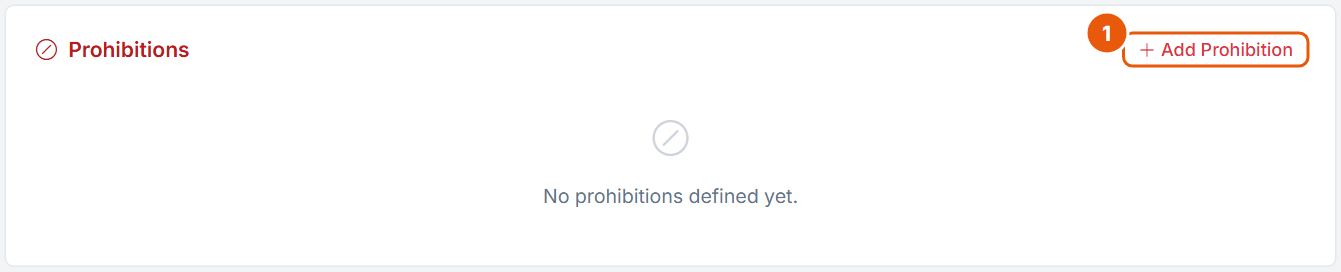
A prohibition stops a combination of levels from appearing in the same product. Use them sparingly (Section 7).
Figure 10. The Prohibitions step (the Pizza task has none).
No.
Control
What it does
1
Add Prohibition
Opens the dialog in Figure 11. Disabled while a design exists. Up to 50 prohibitions.
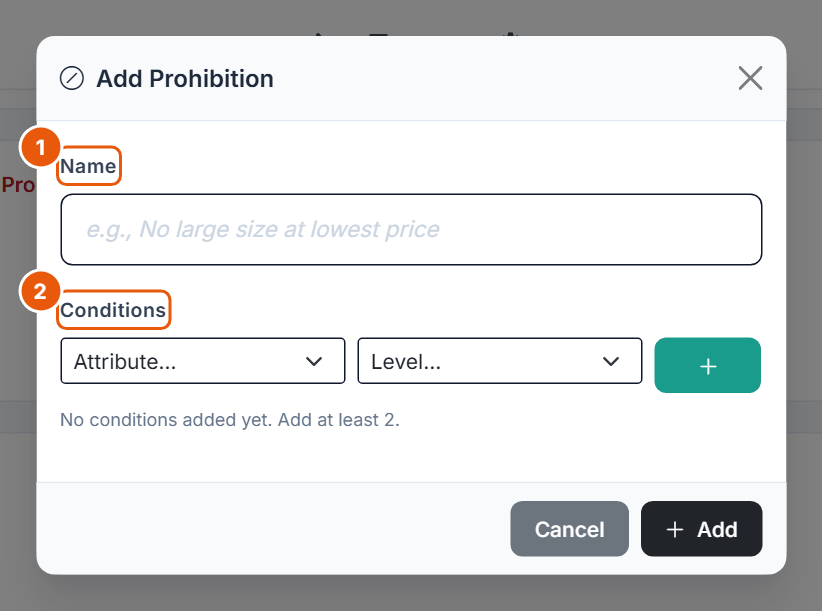
Figure 11. The Add Prohibition dialog.
No.
Control
What it does
1
Name
A description, for example "No cheesy crust at the lowest price".
2
Conditions
Attribute and level, then +. Add at least 2 conditions.
Templates
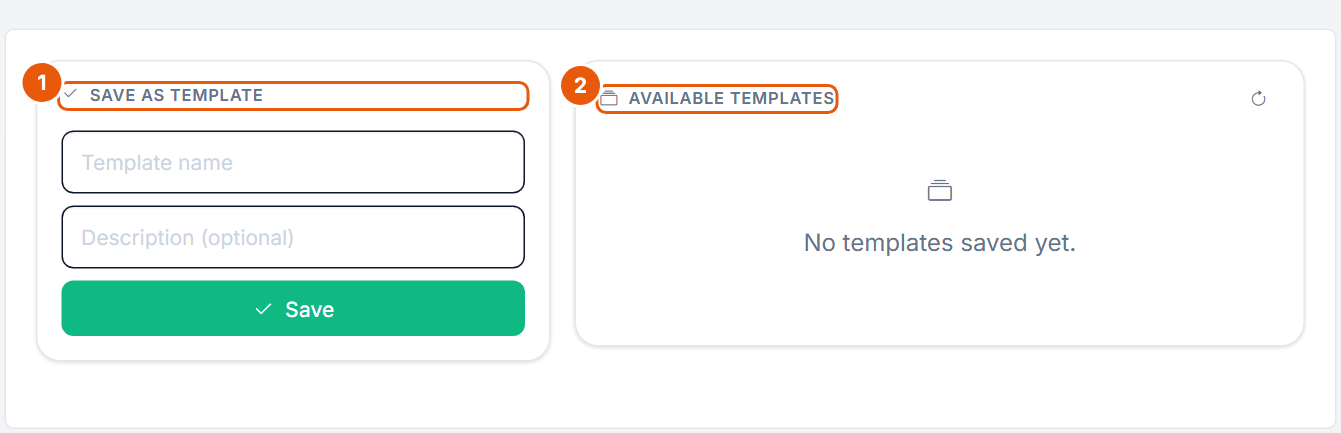
Figure 12. The Templates step.
No.
Control
What it does
1
Save as Template
Template name (required) and an optional description, then Save. Disabled until attributes exist: "Define attributes first to save a template."
2
Available Templates
Your saved templates, with a refresh button. Applying one asks: "This will replace your current attributes, images, prohibitions, and product images."
6. Generate, Diagnostics and Preview
Generate
The Generate step builds the experimental design. DR-CBC uses the same design generator as CBC. The follow-up question needs no design columns, so the design only covers the product profiles.
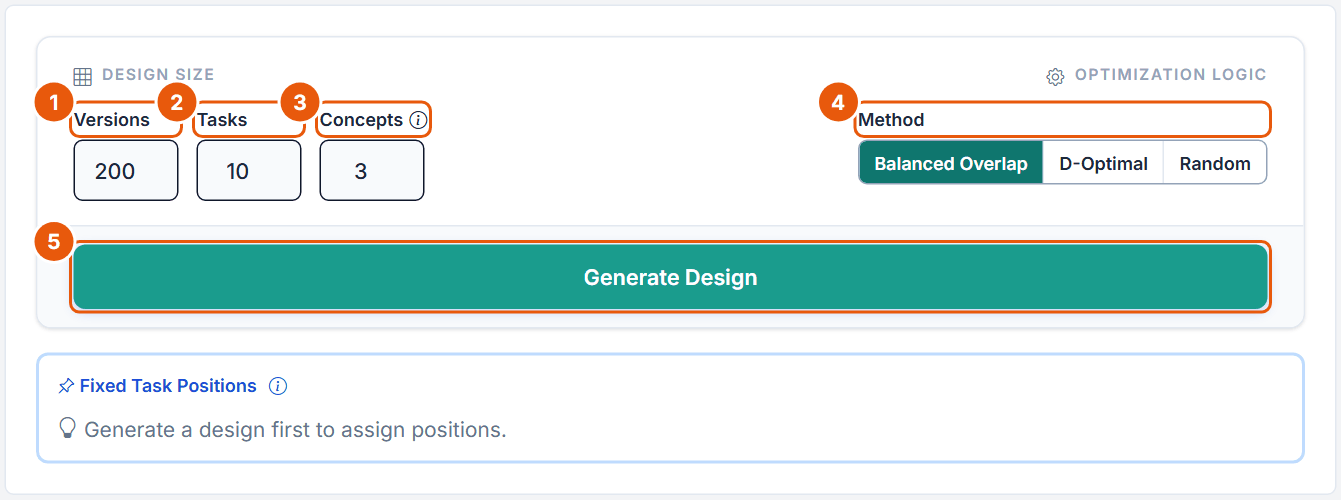
Figure 13. The Generate step before a design exists.
No.
Control
What it does
1
Versions
Number of different questionnaire versions (blocks); each respondent gets one. Default 200, allowed 1 to 1,000.
2
Tasks
Number of random choice tasks per respondent. Fixed tasks are added on top. Default 10, allowed 1 to 30. In Two-Block mode this is the number per block. Free plan: at most 6 tasks per block, fixed tasks included.
3
Concepts
"Number of alternatives or concepts shown in the task." Default 3, allowed 2 to 9. Free plan: 3. There is no None column; the follow-up plays that role.
4
Method
Balanced Overlap (default): "Balanced-overlap heuristic with level and pair balancing". D-Optimal: "D-efficient heuristic design", slower. Random: "Simple random sampling, no optimization". The overlap target is fixed internally; DR-CBC has no overlap setting.
5
Generate Design
Starts the generation, with a progress bar and a Cancel button. A run is stopped after 300 seconds. If a design exists, Choicery asks "Replace existing design? ..."; the previous design is backed up. If responses exist (also in the Bin), generation is blocked and a dialog offers Open Bin.
Before generating, the editor warns when a level must repeat within a task ("Repeated levels are unavoidable with N alternatives for ..."), which happens when Concepts is larger than an attribute's level count. On success it reports, for example, "DR-CBC design generated: 200 versions with 10 random tasks + 2 fixed tasks per version."
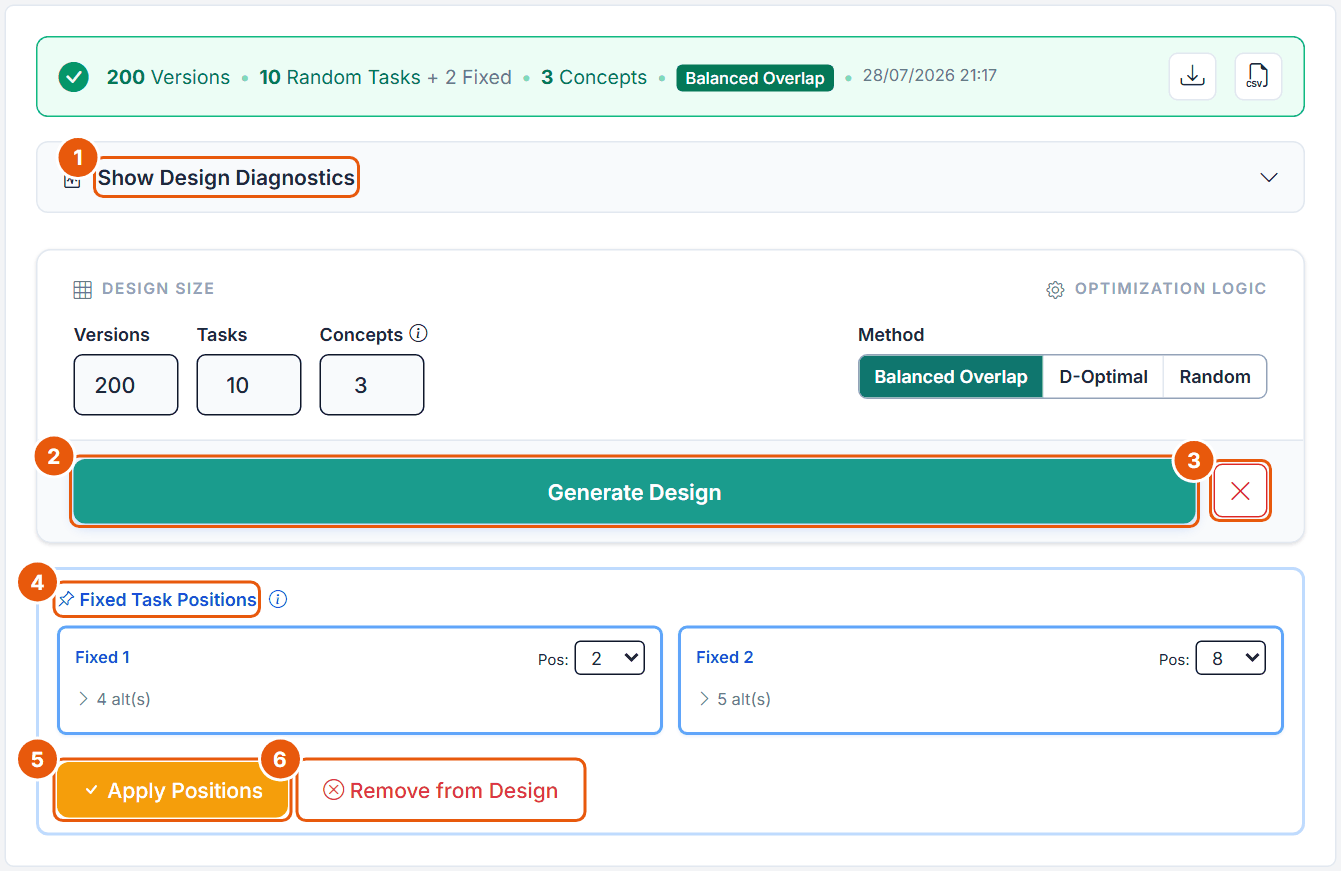
Figure 14. The Generate step after generation: 200 versions, 10 random tasks + 2 fixed, 3 concepts, Balanced Overlap.
No.
Control
What it does
1
Show Design Diagnostics
Opens the diagnostics panel (Figure 15). Above it, the status bar summarizes the design and offers Download Report (arrow icon) and Download Design CSV (CSV icon).
2
Generate Design
Generates a new design that replaces the current one (after confirmation).
3
× (Delete design)
Deletes the design and unlocks attributes and prohibitions. Disabled once responses exist: "Design locked: responses already collected. Delete all responses to unlock."
4
Fixed Task Positions
Only with fixed tasks. Pick a position (Pos:) for each fixed task. "Position 1 = first task shown, Position 2 = after first random task, etc." Here the fixed tasks sit at positions 2 and 8 of 12.
5
Apply Positions
Inserts the fixed tasks at those positions in every version. Each position must be unique ("Duplicate positions found").
6
Remove from Design
Takes the fixed tasks out of the design again (their definitions stay on the Fixed Tasks step).
Design Diagnostics
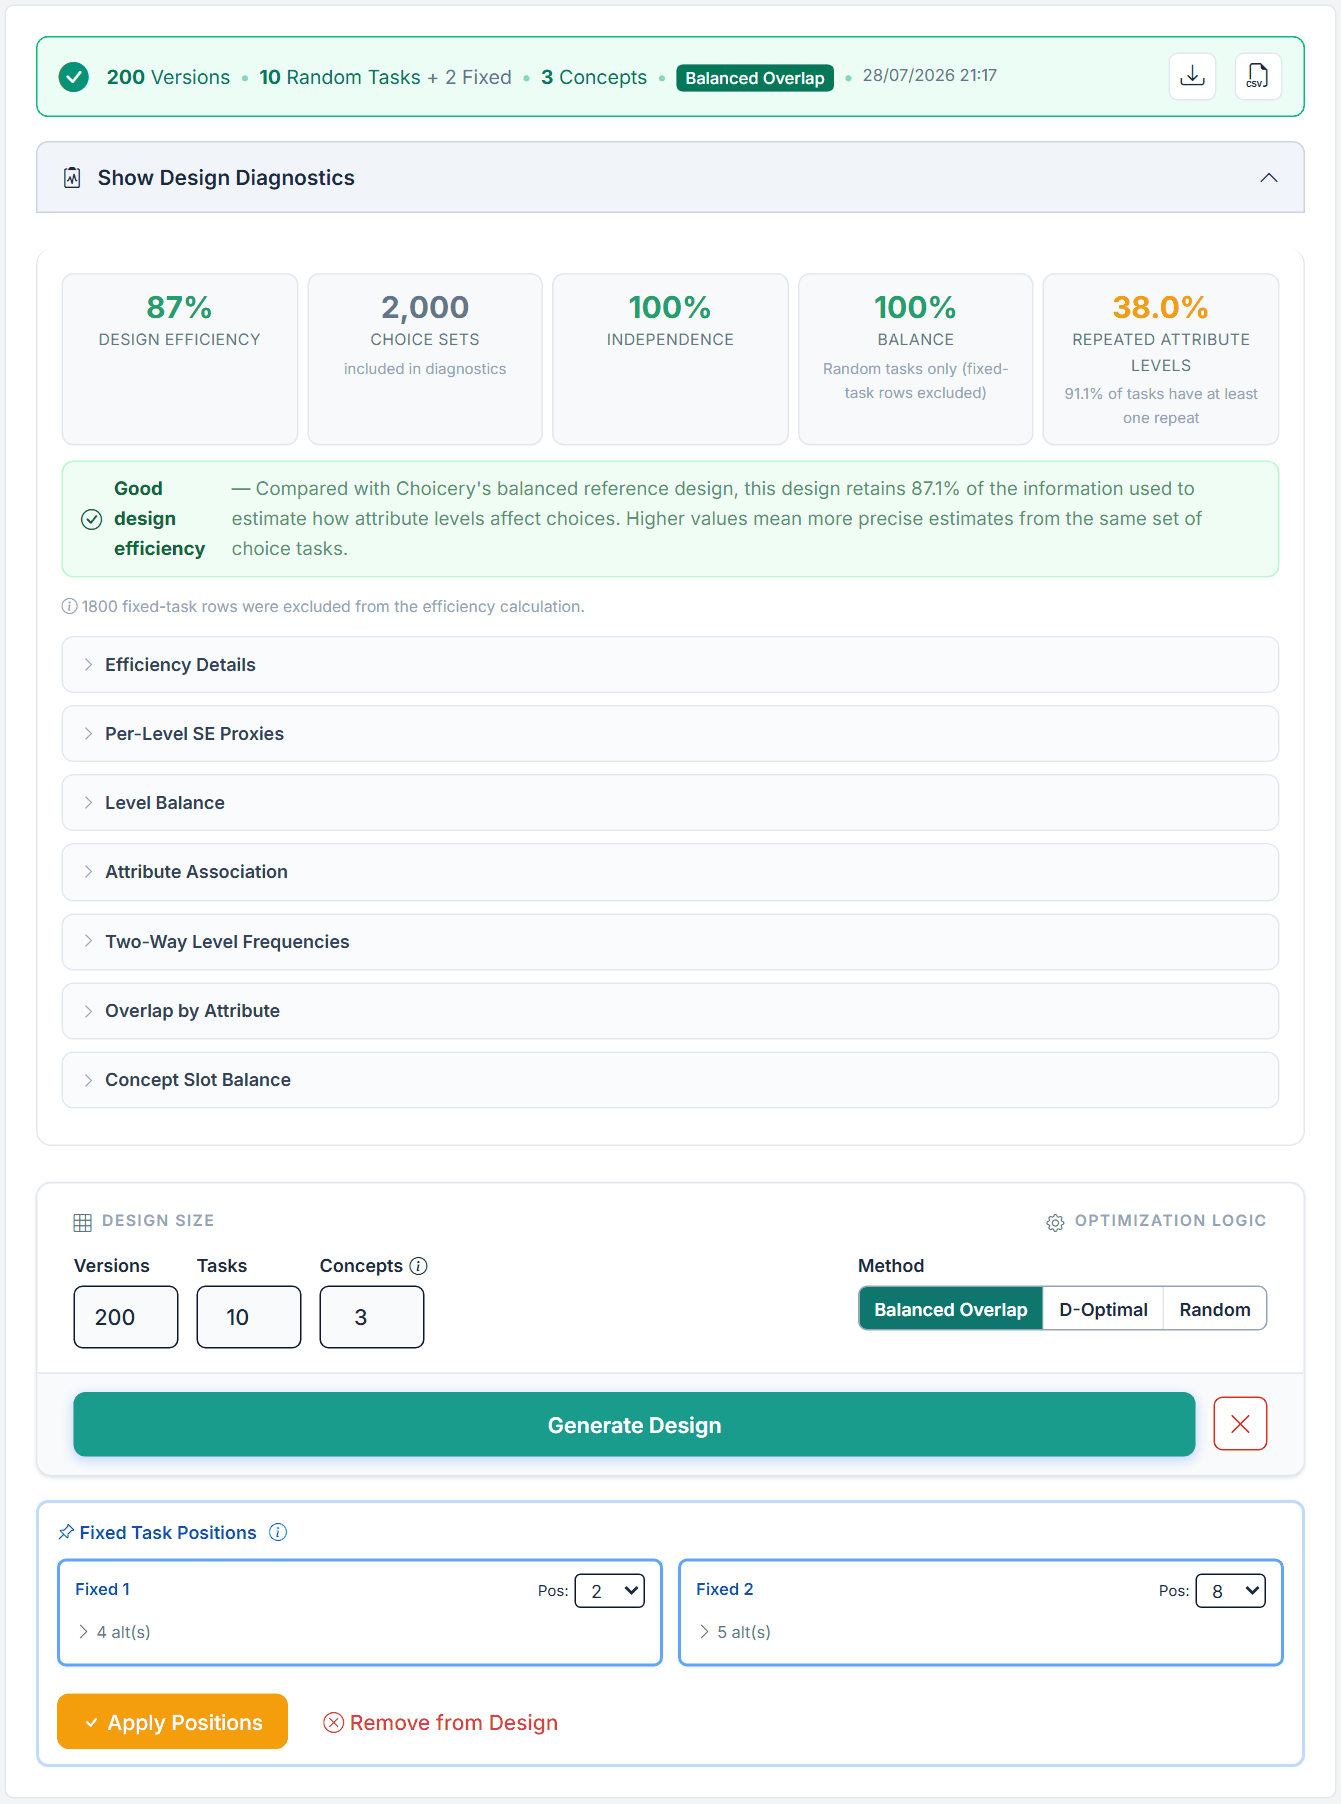
Figure 15. The design diagnostics of the Pizza task.
Element
Pizza value
What it means and what to do
Design Efficiency
87%
Information the design keeps compared with Choicery's balanced reference design. The verdict line ("Good design efficiency") explains it. Higher means more precise estimates from the same tasks. A low value: reduce prohibitions, or try another method.
Choice Sets
2,000
Random choice sets included in the diagnostics (200 versions x 10 tasks). The note below says how many fixed-task rows were excluded (here 1,800).
Independence
100%
How uncorrelated the attributes are across the design. Values well below 100% usually come from prohibitions.
Balance
100%
How evenly the levels appear (random tasks only).
Repeated Attribute Levels
38.0%
Share of attribute slots where a level repeats within a task, and the share of tasks with at least one repeat (here 91.1%). Some overlap is intended with Balanced Overlap.
Efficiency Details
D-efficiency, A-efficiency ratio, number of parameters, condition number. With an Expected None Share it also lists "Proxy Expected None", "Proxy None Scope" and "Efficiency Scope: Product profiles; the follow-up choice is modeled separately".
Per-Level SE Proxies
Expected standard error per level. Rule of thumb: 0.05 or lower.
How often each level and each pair of levels appears, and how strongly attributes are associated.
Overlap by Attribute, Concept Slot Balance
Repeats per attribute, and whether each level appears equally often in each card position.
All efficiency figures describe the product profiles. The follow-up answer is not part of the design objective, so the diagnostics are a proxy for the efficiency of the full dual-response model.
Preview
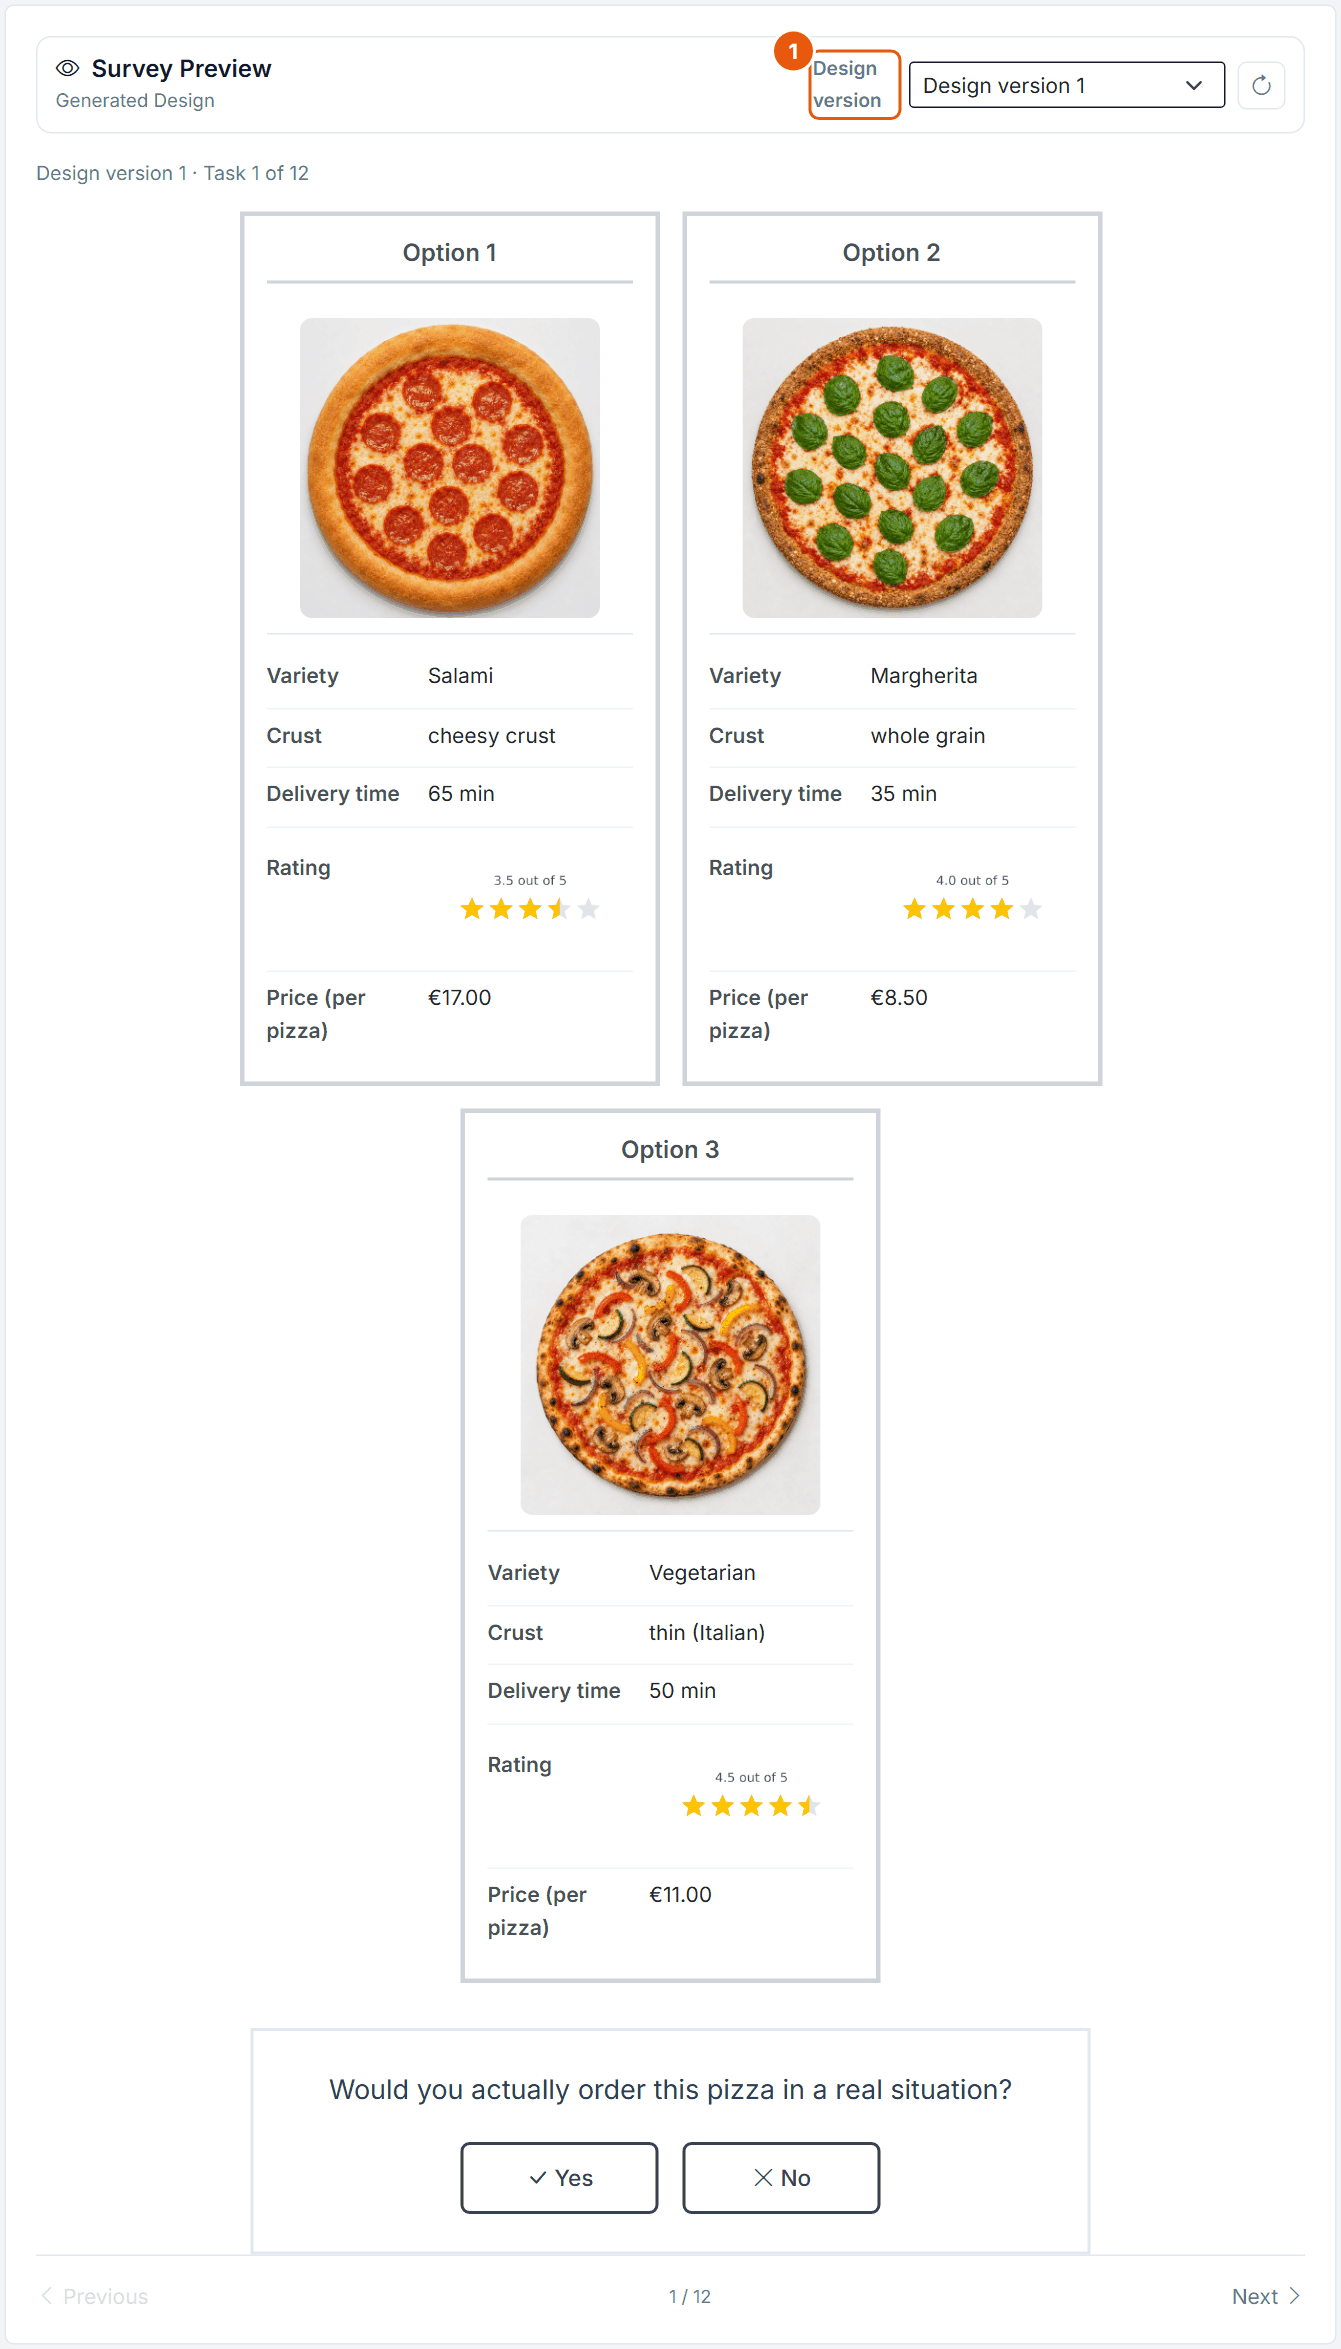
Figure 16. The Preview step of the Pizza task: task 1 of 12 in design version 1.
No.
Control
What it does
1
Design version
Chooses the version to page through with Previous and Next; the button next to it reloads the preview. Before a design exists the preview shows "Example Preview" with sample rows.
The Preview always shows the Integrated layout
The editor Preview shows the follow-up directly below the choice, whatever the mode. It does not show the Block 2 pages of Two-Block mode (introduction text and the repeated product) and ignores "Show after option selection". To check the real flow, use a test run of the survey.
7. How Large Should Your Study Be?
The editor limits are technical ceilings, not recommendations. The table gives the values from the literature; DR-CBC uses the same design rules as CBC.
Topic
Recommendation
Source
Choicery limit
Attributes
About 6 to 8 at most; many respondents struggle with more and start to simplify. Sources disagree: Orme (in Rao, 2026) recommends CBC for 4 attributes or fewer, Orme and Chrzan (2017) only worry from 15 on.
Orme 2020, ch. 6.1, p. 50; Rao 2026, p. 527; Orme & Chrzan 2017, ch. 7
20 (Free plan 4)
Levels per attribute
2 to 5, and about the same number for every attribute. Attributes with more levels get more importance (number-of-levels effect). About 5 levels are enough for price.
Orme 2020, ch. 6.2, pp. 52-53; Rao 2026, pp. 74-75
2 to 20 (Free plan 4)
Tasks per respondent
8 to 12; more than about 15 no longer improves, and may reduce, HB prediction. Mild disagreement: Sablotny-Wackershauser et al. (2024) find that in standard CBC predictive validity can peak well before the last task.
Orme 2020, ch. 11.3, p. 109; Goeken et al. 2024, p. 150; Sablotny-Wackershauser et al. 2024, Web Appendix H, pp. 139-140
1 to 30 (Free plan 6 incl. fixed)
Tasks with dual response
Each dual-response task carries more information: 10 dual-response tasks beat 15 single-response tasks.
Hung, Liu et al. 2025, pp. 865-867
Concepts per task
3 to 5. With 4 or more, respondents in high-involvement categories screen down to about 2.
Orme 2020, pp. 47, 62; Rao 2026, p. 234; Orme & Chrzan 2017, ch. 4
2 to 9 (Free plan 3)
Sample size
n × t × a / c ≥ 500, better 1,000 (n respondents, t tasks, a concepts per task without None, c largest number of levels). In any case at least 300 respondents, or 200 per subgroup you want to report. Plan to drop 10 to 30% poor respondents.
Orme 2020, ch. 7.5, p. 64 and ch. 11.4, pp. 110-111; Orme & Chrzan 2017, ch. 8
no limit
None / no-buy share
About 5 to 20% is typical for a standard None; dual response raises it. The None is unstable: it rises in later tasks and with difficult tasks. Remove respondents who never buy (Hung et al. removed 8 of 318; keeping them inflated the equilibrium prices).
Orme 2020, p. 111; Orme & Chrzan 2017, ch. 5; Hung, Liu et al. 2025, p. 863
Holdouts (fixed tasks)
More than one; one fixed holdout task "is not enough". Telling the right model from a wrong one needs about 7 in-sample holdouts. Older ratings-based practice uses 2 to 4.
Orme 2020, pp. 191-192; Orme & Chrzan 2017, ch. 6; Rao 2026, p. 76
up to 20
Versions
"Bigger is better", but about 10 to 12 good versions capture most of the value.
Orme & Chrzan 2017, ch. 3
1 to 1,000 (default 200)
Prohibitions
Sparingly or not at all; they almost always reduce efficiency. Prefer combined attributes or conditional pricing.
Pizza uses t = 10 random tasks, a = 3 concepts, and c = 4 (Delivery time, Rating and Price have 4 levels).
n ≥ 500 × 4 / (10 × 3) = 67 (minimum)
n ≥ 1,000 × 4 / (10 × 3) = 134 (better)
floor: at least 300 respondents, or 200 per reported subgroup
-> plan for 300 or more completes, plus 10 to 30% for cleaning
With the Free plan limit of 6 tasks (fixed tasks included, so 4 random tasks with the two holdouts) the rule gives 167 and 334 respondents.
8. What the Respondent Sees
The forced choice has no None card. The respondent clicks a product card (the chosen card is outlined) and answers the follow-up. If something is missing, the page shows "Please choose one of the options.", "Please answer the question below." or "Please choose one of the options and answer the question below." These texts can be changed per language in the project settings.
Integrated: one page per task, cards on top, follow-up below. With Show after option selection the follow-up appears once a card is clicked.
Two-Block: first all choice pages (Block 1, no follow-up), then one page per task in the same order (Block 2): the Block 2 Introduction Text, the chosen product, the follow-up question and the Yes/No buttons in the saved style.
Figure 17. A Pizza DR-CBC task in Integrated mode (survey preview, Task 1 of 12): Option 2 is chosen, and the follow-up "Would you actually order this pizza in a real situation?" below shows Yes selected with the green border. The Pizza study itself uses Two-Block; the mode was switched for this picture.
9. Estimation and Results
Open the analysis hub, pick the DR-CBC task and stay on Preference Analysis (HB). Settings, convergence checks and results are the same as for CBC and are explained in the Preference Analysis (HB) guide. Two points are specific to DR-CBC.
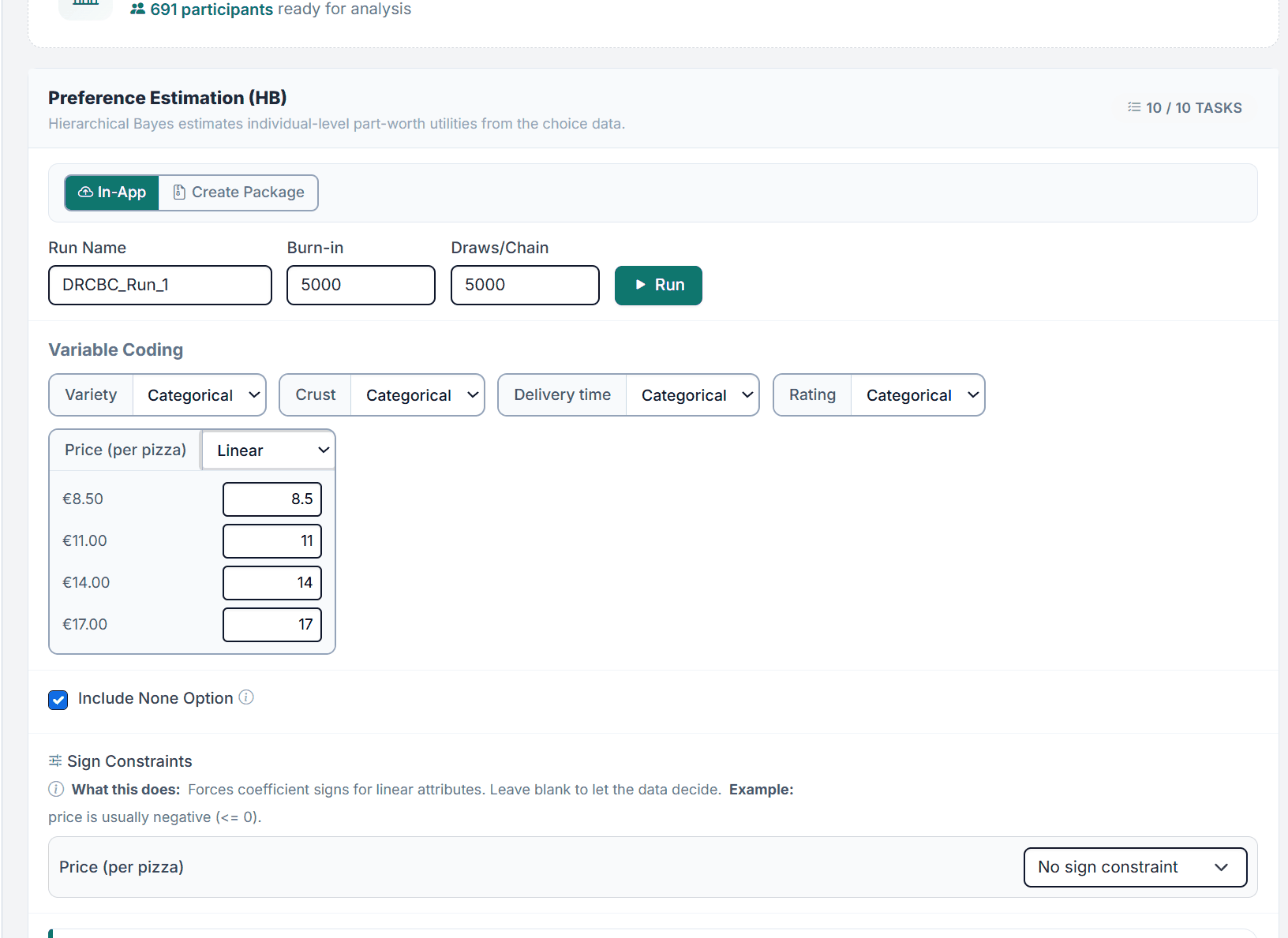
Figure 18. The Preference Estimation (HB) card for the Pizza DR-CBC task (691 participants, 10 of 10 tasks): Variable Coding with Price (per pizza) set to Linear and its values 8.5 to 17, Include None Option ticked and the Sign Constraints row.
Include None Option (ticked by default, only for dual-response tasks): "Uses the DR-CBC Yes/No follow-up in estimation. If a respondent chooses a product first but answers "No" to actually choosing it, Choicery treats that task as None / no-choice. Disable it to estimate only among shown product options." Before the sampler runs, Choicery stacks the two answers of each task into one or two logit observations (Part II, Section 13). Fixed tasks are not used for estimation.
Flat second answers. If the whole sample gives only one follow-up answer, the run warns that the None response is completely separated, and the None constant then depends strongly on the prior. There is no automatic flag per respondent, so check the spread of Yes and No answers yourself.
The None in the results
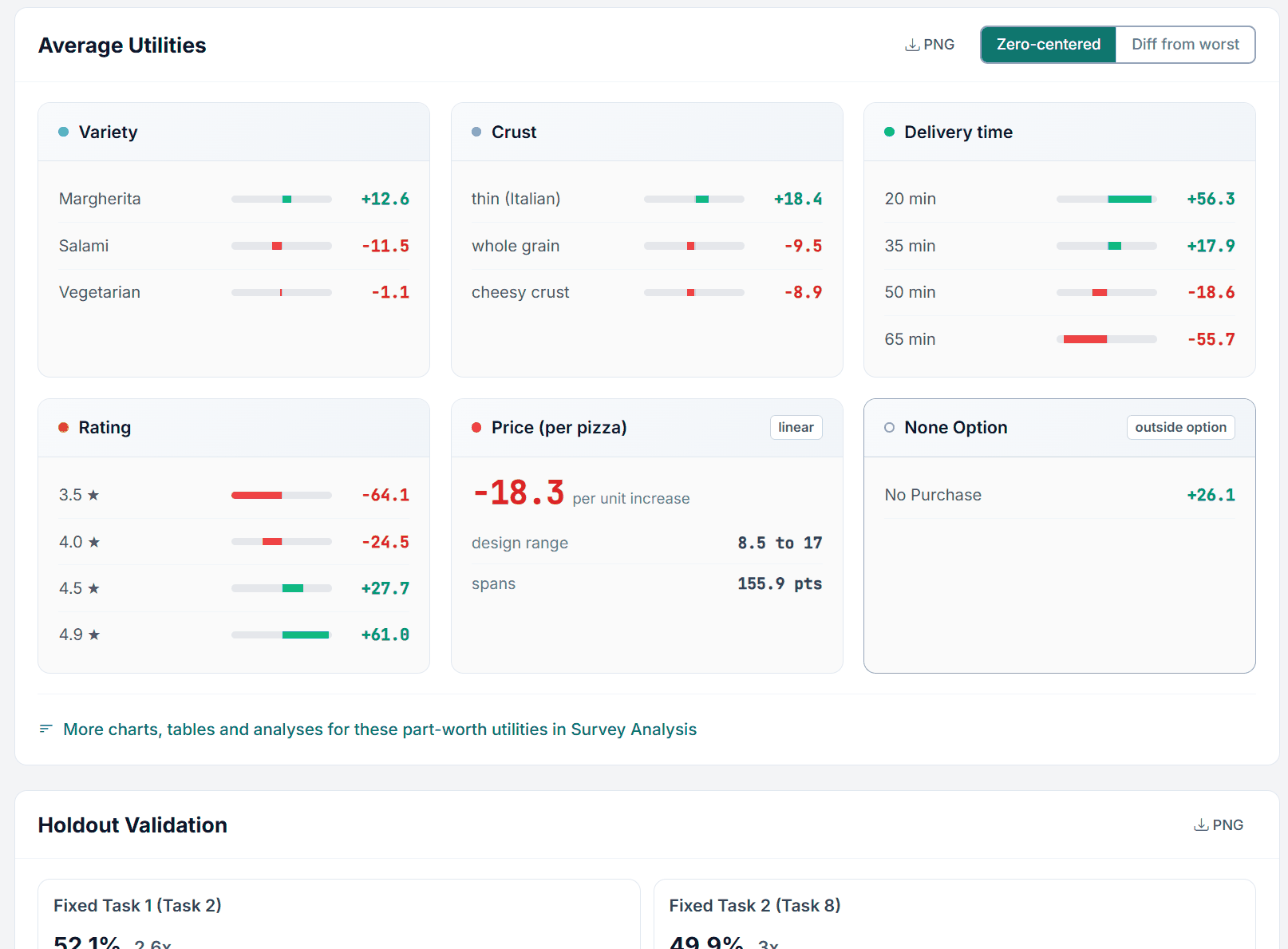
The None is one constant on the same utility scale as the products. It appears at the end of the Average Utilities section as the card None Option with the single level No Purchase. A strongly negative value means most respondents buy something; a value near the products means the category is a hard sell. The None is not an attribute range, so it does not enter the importances.
Figure 19. Average Utilities of the short demo run DRCBC_Run_1 (5,000 burn-in, 5,000 draws, zero-centered): the linear Price card (−18.3 per euro, 155.9 points across 8.5 to 17) next to the None Option card (No Purchase +26.1), followed by the Holdout Validation block with the two fixed tasks.
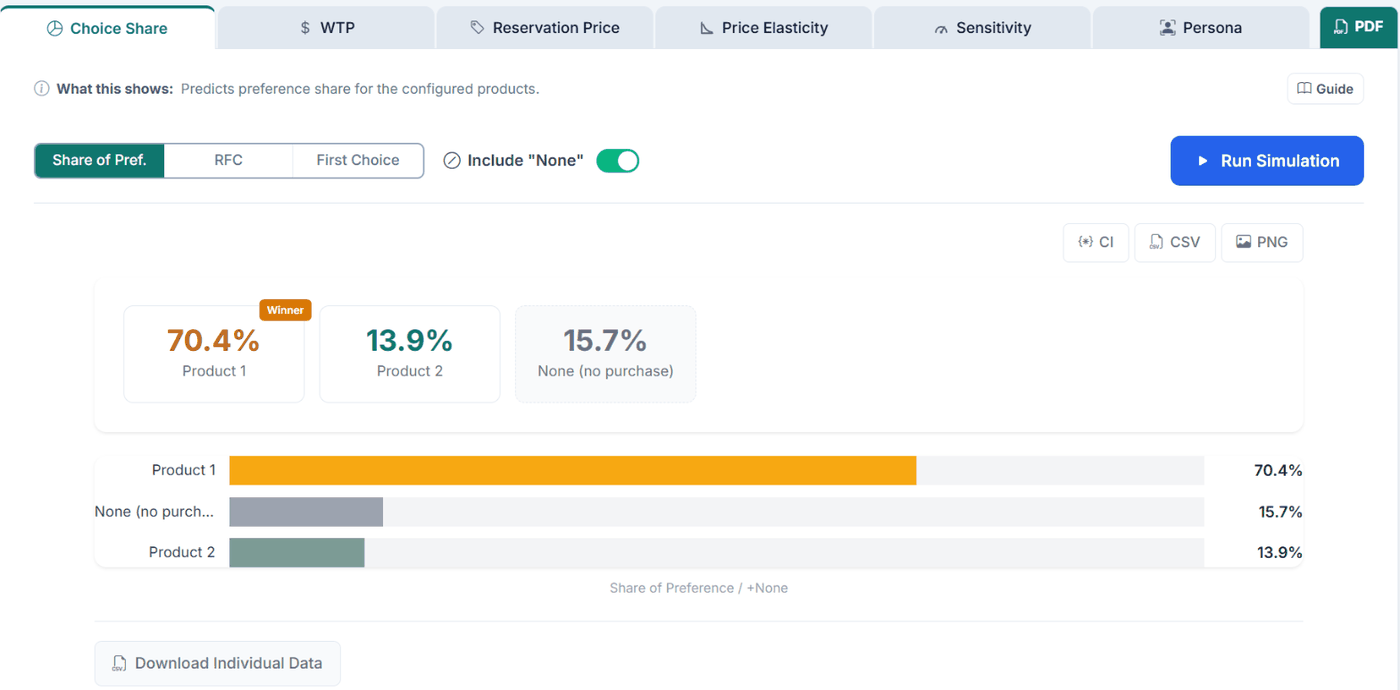
To turn the None into a share, run the Market Simulator with Include "None" switched on. The no-purchase share is then the part of the market that walks away from that set of offers. The switch is only shown when the run estimated a None; otherwise the simulator shows "None not available in active run". Be careful when the simulated scenario has more or fewer products than the survey tasks: the None share depends on the number of alternatives shown (Orme & Chrzan, 2017, ch. 5).
Figure 20. Market Simulation, Choice Share tab, with Include "None" switched on (demo run DRCBC_Run_1). Product 1 (Margherita, thin crust, 20 min, 3.5 ★, 8.50) takes 70.4 percent, Product 2 (Salami, thin crust, 35 min, 4.5 ★, 14.00) 13.9 percent, and 15.7 percent choose no purchase.
Word the follow-up realistically and for your category ("Would you actually order this pizza in a real situation?"). The None is only as meaningful as that question.
When respondents may not know market prices, show price and feature information before the tasks; Hung, Kurz et al. (2025, pp. 12-13) found that otherwise respondents learn prices from the tasks and the None value drifts upward across tasks.
Include a price attribute, so the no-buy share responds to price.
Use more than one fixed task as holdouts, and keep the design within the ranges of Section 7.
Check the real Two-Block flow in a survey test run, because the editor Preview shows only the Integrated layout.
Do not
Do not treat a high no-buy rate as noise. It is the signal DR-CBC exists to capture; only respondents who never buy in any task should be removed.
Do not read the None as an attribute level. It is a threshold and is excluded from importances.
Do not forget the hidden button settings in Two-Block mode (style, icons, green/red border). Set them in Integrated mode first.
Do not overload tasks. Three or four concepts plus the follow-up are plenty.
Part II
Theoretical Background
The random utility model, the None as an alternative-specific constant, and the data stacking that turns a "No" into a no-purchase observation.
11. Key Definitions
Attribute and level
An attribute is a feature that varies (Price (per pizza)); a level is one of its values (€11.00). A profile (concept) is one level per attribute.
Forced choice (first response)
The ordinary CBC question: choose one of the shown concepts. There is no opt-out on this screen, so a choice is always made.
Buy question (second, free response)
The follow-up: would you actually buy the concept you just chose? Answered Yes (would buy) or No (would not buy).
None / no-purchase outcome
The outcome a "No" reveals: the respondent would rather buy nothing than buy the best of what was shown.
None utility (ASC)
A single alternative-specific constant that carries the appeal of not buying, on the same scale as the concepts. It sets the no-purchase threshold.
Data stacking
Turning the two answers from one task into one or two multinomial-logit observations, so the same logit machinery can use both.
Hierarchical Bayes (HB)
An estimation method that models each respondent's utilities as drawn from a population distribution, so individual estimates borrow strength from the group.
RLH (root likelihood)
Geometric mean of the predicted probabilities of the chosen alternatives; a fit measure. Chance level is one over the number of alternatives in the set.
12. The Random Utility Model & Logit
DR-CBC rests on the same random utility theory as CBC (McFadden, 1974). Respondent h assigns to profile j a utility that is the sum of the part-worths of its levels plus a random error:
Uhj = Xj′ βh + εhj
Utility of profile j for respondent h; Xj codes the levels, βh is the respondent's part-worths.
The no-purchase alternative is different: it has no attributes, so its systematic utility is a single constant, the same in every task. This is the None utility, often written ASCnone:
Uh,none = βnone,h + εh,none
The no-purchase alternative carries one alternative-specific constant per respondent, plus error. No level codes it.
When the choice set includes the None, the multinomial logit probability of picking concept j puts the None term in the denominator like any other alternative:
Choice probability over a set that includes the no-purchase option. The sum over k runs across the shown concepts.
This is the same likelihood every CBC-family method maximises. What differs between CBC, DR-CBC, Best-Worst CBC, and MaxDiff is only how observations are constructed and stacked before this same logit is applied. For DR-CBC, that construction is the subject of the next section.
13. Data Stacking: How the Buy Question Becomes a None
The two answers per task cannot both be fed to the logit as they stand, because they express different comparisons. The forced choice says "this concept beats the other concepts". The buy answer says something about the concept versus not buying. Stacking translates the pair into one or two logit observations using the standard dual-response convention.
The rule
Code the buy answer as a variable that is 1 for "would buy" (Yes) and 2 for "would not buy" (No). Then:
Yes → 1 observation over { concepts, None }, chosen concept wins No → 2 observations: { concepts } chosen wins, and { concepts, None } None wins
The dual-response stacking rule. A Yes yields one row; a No yields two.
A task without a usable buy answer is not stacked. For the HB run the DR-CBC data converter skips that task and logs a warning, so only fully answered tasks reach the sampler. Latent Class, Interaction Search and AI-Driven Profile Analysis keep the forced choice as a products-only observation instead.
Why a Yes needs only one row. If the respondent would buy their chosen concept, that concept must beat both the other concepts and the no-purchase option. A single observation over the four-way set { concept A, concept B, concept C, None }, in which the chosen concept wins, captures both facts.
Why a No needs two rows. If the respondent would not buy, there are two separate facts that disagree about the winner. The person still preferred the chosen concept over the other concepts, but preferred not buying over that concept. So the task is split: one three-way observation over { A, B, C } where the chosen concept wins, preserving the preference information, and one four-way observation over { A, B, C, None } where the None wins.
Stacking a Pizza task (chosen concept: the Salami pizza)
Case Yes. The respondent would order the Salami pizza. One stacked observation:
Set: { Margherita, Salami*, Vegetarian, None }
Winner: Salami*
Reads: the Salami pizza beat both rivals AND the no-buy option.
Case No. The respondent would not order it. Two stacked observations:
Across the sample, the Yes tasks and the "None wins" rows from the No tasks identify the None constant. Without the buy question there would be no row in which the None ever wins.
Once every task has been expanded into its one or two rows, the design matrix is built with effects coding (Section 15), and the same multinomial-logit likelihood and Hierarchical Bayes sampler run as for standard CBC, with the None constant as one more coefficient.
Other ways to model dual response
Hung, Liu, Brazell and Allenby (2025) compare three approaches. Collapsing (dropping the first answer when the second is No) wastes information. Treating the two answers as independent draws, which is what the row stacking above does, is in their view less plausible. Their "Unified Model" uses the same error draw for both answers (equal to the DR-AnyMax model of Diener et al.) and yields about 30% more information than collapsing (pp. 858-861, 865-867). Choicery's in-app estimation uses the stacking rule above, not the Unified Model.
14. Hierarchical Bayes Estimation
Rather than estimate one average model (aggregate logit), HB estimates individual part-worths and a population distribution that ties them together (Lenk, DeSarbo, Green, & Young, 1996; Rossi, Allenby, & McCulloch, 2005). The None constant is estimated for each respondent like any other coefficient. The model has two levels:
Individual part-worths (including the None constant) are drawn from a population normal; the mean and covariance have diffuse priors.
Choicery draws from the posterior with a Gibbs sampler that alternates three steps per iteration: a Metropolis-Hastings update of each respondent's βh (proposals shaped by the current covariance Σ), a Gibbs draw of the population mean μ, and a Gibbs draw of Σ from its Inverse-Wishart posterior. The default target prior variance is 4.0, and the Inverse-Wishart degrees of freedom are the number of parameters plus 5. The per-respondent likelihood is the product of the logit probabilities of all the stacked observations that belong to that respondent.
Why HB instead of one aggregate model?
A single aggregate logit hides heterogeneity: if half the market is price-sensitive and half is not, the average looks moderately price-sensitive and describes nobody. The same is true of the None: people differ in how readily they walk away. HB recovers a price sensitivity and a no-buy threshold for each person, which is what a realistic no-buy simulation needs.
Aggregate logit: one β (and one None) for everyone.
HB: one β_h per respondent, drawn from MVN(μ, Σ).
A credible no-buy share needs the individual β_h and None_h.
Convergence diagnostics
R-hat below 1.05 (good) or 1.1 (acceptable) signals that independent chains agree. Effective sample size above 100 supports point estimates; above 400 is comfortable for intervals. If either is weak, use at least two chains, inspect the acceptance rate, and reallocate burn-in versus post-burn-in draws within the shared budget. Details: Preference Analysis (HB) guide.
Attribute levels enter the model through effects coding. For an attribute with L levels, L minus 1 indicator columns are used and the last level is the negative sum of the others, so the part-worths of an attribute always sum to zero:
Effects coding. The reference level is the negative sum, so Σ utilities = 0 within the attribute.
The None constant is not effects-coded. It is a single alternative-specific column that is 1 for the no-purchase alternative and 0 for every concept, so its coefficient is a free-standing threshold rather than part of any attribute. That is why it is reported on its own and excluded from importances.
Raw utilities are on the model's logit scale and their absolute size depends on response consistency, so they are not comparable across respondents or studies. Zero-centered diffs (ZC) rescale each respondent so that the average attribute range equals 100:
ZCi = Rawi × (100 / average attribute range)
Zero-centered-diff rescaling. After this, an attribute range of 100 is "average importance".
Importance of an attribute is its utility range divided by the sum of all ranges, expressed as a percentage:
Attribute importance. Computed per respondent, then averaged. The None constant is not an attribute range and does not appear here.
Because importances are computed per respondent and then averaged, they reflect that different people weight attributes differently.
16. Experimental Design
The experimental design for DR-CBC is the same design you would build for standard CBC. Two properties matter: level balance (each level appears about equally often) and orthogonality (levels of different attributes are as uncorrelated as possible). Choicery generates designs with a balanced-overlap algorithm by default, which allows a controlled amount of level repetition within a task; D-Optimal and Random are the alternatives on the Generate step. Multiple versions (blocks) spread the full design across respondents.
The dual-response layout does not touch the design. Whether you present the buy question integrated or in a separate block, the concepts shown in each task come from the same design matrix; the buy question is asked about whichever concept the respondent chose, so it needs no design columns of its own.
Why not a full factorial?
The Pizza attributes have 3, 3, 4, 4 and 4 levels, so there are 3 × 3 × 4 × 4 × 4 = 576 possible profiles. Showing them all is impossible, so CBC uses a fractional design that still identifies every part-worth. The buy question then adds the information needed to pin down the None.
17. References
Brazell, J. D., Diener, C. G., Karniouchina, E., Moore, W. L., Séverin, V., & Uldry, P.-F. (2006). The no-choice option and dual response choice designs. Marketing Letters, 17(4), 255-268.
Goeken, N., Kurz, P., & Steiner, W. J. (2024). Multimodal preference heterogeneity in choice-based conjoint analysis: A simulation study. Journal of Business Economics, 94, 137-185.
Hung, C.-Y., Kurz, P., Bailey, R. A., Huber, J., & Allenby, G. M. (2025). Re-examining the no-choice option in conjoint analysis. Journal of Choice Modelling, 57, 100578.
Hung, C.-Y., Liu, Y. M., Brazell, J. D., & Allenby, G. M. (2025). Dual response in conjoint analysis. Marketing Letters, 36(4), 857-873.
Lenk, P. J., DeSarbo, W. S., Green, P. E., & Young, M. R. (1996). Hierarchical Bayes conjoint analysis: Recovery of partworth heterogeneity from reduced experimental designs. Marketing Science, 15(2), 173-191.
Louviere, J. J., Hensher, D. A., & Swait, J. D. (2000). Stated choice methods: Analysis and applications. Cambridge: Cambridge University Press.
McFadden, D. (1974). Conditional logit analysis of qualitative choice behavior. In P. Zarembka (Ed.), Frontiers in econometrics (pp. 105-142). New York: Academic Press.
Orme, B. K. (2020). Getting started with conjoint analysis: Strategies for product design and pricing research (4th ed.). Manhattan Beach, CA: Research Publishers.
Orme, B. K., & Chrzan, K. (2017). Becoming an expert in conjoint analysis: Choice modeling for pros. Orem, UT: external conjoint software.
Rao, V. R. (2026). Applied conjoint analysis (2nd ed.). Springer. (Chapter 16 is written by B. Orme.)
Rossi, P. E., Allenby, G. M., & McCulloch, R. (2005). Bayesian statistics and marketing. Chichester: John Wiley & Sons.
Sablotny-Wackershauser, V., Lichters, M., Guhl, D., Bengart, P., & Vogt, B. (2024). Crossing incentive alignment and adaptive designs in choice-based conjoint: A fruitful endeavor. Journal of the Academy of Marketing Science, 52(3), 610-633. Web Appendix.
Schlereth, C., & Skiera, B. (2017). Two new features in discrete choice experiments to improve willingness-to-pay estimation that result in SDR and SADR: Separated (adaptive) dual response. Management Science, 63(3), 829-842.
Train, K. E. (2009). Discrete choice methods with simulation (2nd ed.). Cambridge: Cambridge University Press.