Product & pricing
Fourteen features. One headline.
Imagine your product can do fourteen things and your landing page has room for three. A thought experiment on finding the headline, the plans and the price.
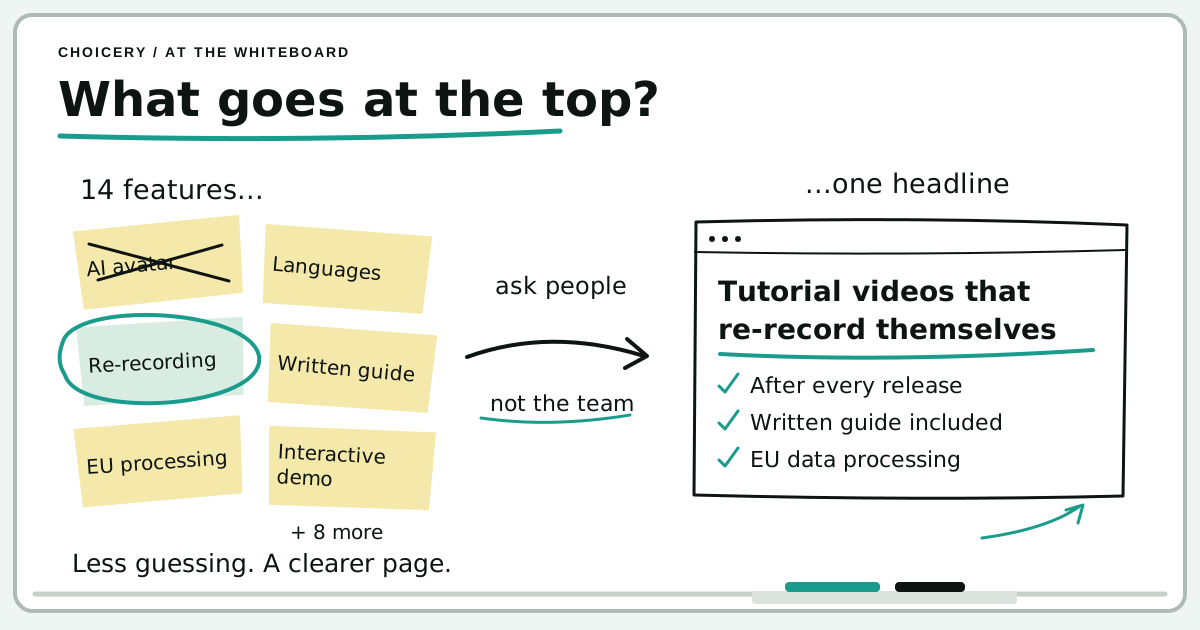
Most products can do more than their landing page can say. The top of the page has room for one headline and maybe three short points. Which ones? And as soon as that is settled, the next questions follow: what goes into which plan, and what can you charge for it?
We know this from our own homepage. A long feature list is easy to collect. Deciding what a visitor sees first is the hard part.
Most teams settle it by discussion. The founder’s favourite wins, or the feature that looks best in a demo, or whatever the loudest competitor puts on its pricing page. Asking customers does not help much either: “Would you like feature X?” gets a polite yes for every feature.
There is a calmer way, and it takes two short surveys:
- The first finds out what to say. People rank your features against each other, and then tell you which ones they would actually pay more for. Liked and paid for are not the same thing.
- The second finds out what to charge. People choose between plans that look like a real pricing page, with real prices. From their choices you can read what each feature is worth in euros.
To show how that works in practice, we played it through with an example.
An example: fourteen features, room for three
Imagine you have built a tool that makes software tutorials on its own. You give it the address of your web app and a task, say “show how to create a project”. It clicks through the app in a real browser and hands you a finished video with a voiceover.
You are three people: two founders and a developer. Launch is six weeks away. The product works.
Now write the landing page.
The top of the page has room for one headline and three short points. Your product has fourteen things worth mentioning.
Your co-founder wants the AI avatar up front. It looks fantastic in every demo. You would lead with the voiceover languages. Your developer keeps saying the real reason to buy is that the tool re-records every video automatically after each release.
There are also written guides, interactive demos, EU data processing, branding and more. Every time you try to shorten the page, someone adds a feature back in.
Image placeholder: the feature fight
Three people in front of a whiteboard covered in fourteen sticky notes, each person pointing at a different note. Friendly, slightly exasperated, nobody is winning.
File: /static/blog/saas-pricing/saas-pricing-team-whiteboard.png
Behind the headline question sit two more. Which features go into which plan? Put too much into the entry plan and nobody upgrades. Put too little in and nobody starts. And what do you charge? Similar tools ask anywhere from €15 to €99 a month, and the “two months free” for the annual plan is copied from someone else’s pricing page.
The first survey: ask the people who already care
So you run the two surveys from above. The first finds out what deserves the headline. The second puts the strongest features into real-looking plans, with prices, and lets people choose.
Image placeholder: two surveys
A simple two-step path: on the left, a small crowd of friendly early fans with a waitlist sign; on the right, a different group of professionals at their desks. An arrow from step 1 (what to say) to step 2 (what to charge).
File: /static/blog/saas-pricing/saas-pricing-two-waves.png
For the first survey you go to the people who already care. Say your coming-soon page has collected about 1,900 sign-ups. You email them, post the link in two founder communities and mention it in your newsletter. Three months of the Pro plan are raffled as a thank-you.
Fans are exactly right for this question. They signed up for a reason, and the landing page has to tell the next visitor that same reason.
The survey is an Anchored MaxDiff. People see four features at a time and pick the most and the least important one, eleven times. At the end they answer one question per feature: “Would you pay more for this feature?” That last question is the anchor. It separates features people like from features people would pay for.
The demo favourite comes last
Here is what 390 participants tell you.
Preference Scores
- 1Automatically re-records the video after every release16.1%80.0%
- 2Step-by-step written guide with screenshots12.8%69.4%
- 3Data is processed in the EU9.3%54.9%
- 4Sensitive data is blurred automatically8.6%53.1%
- 5Voiceover also in German8.2%48.9%
- 6Interactive click-through demo8.2%50.9%
- 7Edit the script before the video is created7.1%45.9%
- 8Embed the videos in your help center or docs6.8%44.1%
- 9Your own branding (logo, colours, intro and outro)6.6%42.9%
- 10Viewer statistics: who watched and where they stopped4.5%32.4%
- 11Your own voice as the narrator3.9%29.0%
- 12Voiceover also in Spanish3.6%26.4%
- 13Voiceover also in French2.5%20.1%
- 14AI avatar as presenter1.8%14.6%
Bars show Relative Preference and sum to 100%; the top three bars are highlighted. P(Accept) is the share of respondents who would pay more for the feature, each feature on its own.
Mean-anchored index. The average feature is fixed at 100 (black dotted line), so 200 means twice as preferred as the average and 50 means half as preferred.
- 1Automatically re-records the video after every release225
- 2Step-by-step written guide with screenshots180
- 3Data is processed in the EU131
- 4Sensitive data is blurred automatically121
- 5Voiceover also in German115
- 6Interactive click-through demo115
- 7Edit the script before the video is created99
- 8Embed the videos in your help center or docs95
- 9Your own branding (logo, colours, intro and outro)92
- 10Viewer statistics: who watched and where they stopped63
- 11Your own voice as the narrator54
- 12Voiceover also in Spanish50
- 13Voiceover also in French35
- 14AI avatar as presenter25
Automatic re-recording wins clearly: 16.1% relative preference, and 80% would pay more for it. The written guide follows with 69%, EU data processing with 55%.
And the avatar? Last place. 1.8% relative preference, 15% would pay extra. It is great for a demo and not much of a reason to buy. That settles a long discussion in one chart.
The headline argument is suddenly short. Keeping tutorials up to date solves a problem your customers have every single release. The avatar mainly impresses the people watching your demo.
Which three points?
The ranking tells you what wins on average. For the three points under the headline you want something slightly different: a set where as many visitors as possible find the one feature they care about most. That is what a TURF analysis in Choicery’s MaxDiff simulator calculates.
TURF Analysis
- 1Automatically re-records the video after every release+56.7%56.7%
- 2Step-by-step written guide with screenshots+18.2%74.9%
- 3Voiceover also in German+9.5%84.4%
- 4Data is processed in the EU+5.6%90.0%
- 5Interactive click-through demo+4.6%94.6%
Greedy build-up: each row adds the feature that reaches the most people who were not reached yet. Someone counts as reached when their own favourite feature is on the list.
| # | Best three-feature combinations | Reach |
|---|---|---|
| 1 | Automatically re-records the video after every release · Voiceover also in German · Step-by-step written guide with screenshots | 84.4% |
| 2 | Automatically re-records the video after every release · Step-by-step written guide with screenshots · Data is processed in the EU | 80.5% |
| 3 | Automatically re-records the video after every release · Step-by-step written guide with screenshots · Interactive click-through demo | 79.5% |
| 4 | Automatically re-records the video after every release · Step-by-step written guide with screenshots · Sensitive data is blurred automatically | 77.2% |
All combinations of three features, ranked by reach.
For 56.7% of people, automatic re-recording is their favourite. Adding the written guide reaches another 18.2%. Third comes German voiceover with 9.5%, ahead of EU processing with 5.6%. That sounds odd until you look at who answered: about a third of the participants work in Germany, and for them German is often the top feature.
Not everyone wants the same
The last questions in the survey asked where people work, how big the company is and how often their software changes. With those, Choicery shows how preferences shift between groups.
Covariate Effects
- Voiceover also in German−9.8 pp
- Step-by-step written guide with screenshots+3.0 pp
- Voiceover also in French+2.8 pp
- Voiceover also in Spanish+2.7 pp
- Automatically re-records the video after every release+1.1 pp
- Sensitive data is blurred automatically+1.0 pp
- Your own branding (logo, colours, intro and outro)+0.8 pp
- Interactive click-through demo−0.8 pp
- Edit the script before the video is created−0.6 pp
- Embed the videos in your help center or docs+0.5 pp
- Your own voice as the narrator−0.5 pp
- Viewer statistics: who watched and where they stopped+0.5 pp
- AI avatar as presenter−0.5 pp
- Data is processed in the EU−0.2 pp
- Voiceover also in German−8.0 pp
- Data is processed in the EU−7.6 pp
- Automatically re-records the video after every release+3.3 pp
- Sensitive data is blurred automatically+2.7 pp
- Viewer statistics: who watched and where they stopped+2.5 pp
- Step-by-step written guide with screenshots+1.9 pp
- Your own branding (logo, colours, intro and outro)+1.8 pp
- Embed the videos in your help center or docs+1.8 pp
- Interactive click-through demo+1.0 pp
- Voiceover also in Spanish+0.4 pp
- Your own voice as the narrator+0.4 pp
- Edit the script before the video is created−0.2 pp
- AI avatar as presenter+0.1 pp
- Voiceover also in French−0.1 pp
- Voiceover also in German−10.5 pp
- Data is processed in the EU−8.3 pp
- Voiceover also in Spanish+3.5 pp
- Your own branding (logo, colours, intro and outro)+2.6 pp
- Step-by-step written guide with screenshots+2.6 pp
- Sensitive data is blurred automatically+2.1 pp
- Interactive click-through demo+2.1 pp
- Viewer statistics: who watched and where they stopped+2.0 pp
- Embed the videos in your help center or docs+1.7 pp
- Your own voice as the narrator+0.9 pp
- Automatically re-records the video after every release+0.8 pp
- Edit the script before the video is created+0.5 pp
- AI avatar as presenter−0.2 pp
- Voiceover also in French+0.1 pp
- Voiceover also in German−10.8 pp
- Data is processed in the EU−4.8 pp
- Step-by-step written guide with screenshots+3.6 pp
- Automatically re-records the video after every release+2.8 pp
- Your own branding (logo, colours, intro and outro)+2.1 pp
- Embed the videos in your help center or docs+2.0 pp
- Sensitive data is blurred automatically+1.8 pp
- Viewer statistics: who watched and where they stopped+1.7 pp
- Interactive click-through demo+1.5 pp
- Voiceover also in Spanish+0.9 pp
- Your own voice as the narrator−0.6 pp
- AI avatar as presenter−0.6 pp
- Edit the script before the video is created+0.5 pp
- Voiceover also in French−0.1 pp
German voiceover is the clearest case. Compared with companies in Germany, its preference drops by around 10 points everywhere else; for North America versus Germany it is −10.5 percentage points. EU processing matters a lot less in North America and outside the EU. So the third point depends on the page: German voiceover on your German landing page, EU processing and automatic blurring everywhere else.
And a first price range
One more block at the end of wave 1 asks four price questions about a planned Pro plan (the Van Westendorp method). The answers give an acceptable range of €20 to €52 a month, with an optimal price point around €29. That is not yet the price. It tells you which prices to test next.
For prices, ask people who don’t know you yet
It is tempting to send the pricing survey to the same waitlist. You already have the addresses.
But fans say higher prices than the market will pay. And anyone who has just spent ten minutes with your feature list does not look at a pricing page like a new visitor does.
So wave 2 goes to new people from a B2B panel, with a short screener: they work at a company that sells web software and make tutorials or help articles themselves. Same kind of people as on your waitlist, but they have never seen your product.
Image placeholder: fans and strangers
Split image. Left: an enthusiastic early fan holding up a big price tag with a high number. Right: a calm, sceptical professional looking at a laptop with three price cards. Light, humorous, no real brands.
File: /static/blog/saas-pricing/saas-pricing-fans-vs-strangers.png
They see something that looks like a real pricing page: three plans side by side, plus the option to pick none. Price, contract, minutes and features change from screen to screen. This is a CBC Shop study with the Pricing Plans layout. Try it:
Which of these plans would you subscribe to?
People chose “none of these” in 15% of the tasks. You want that option in the survey. Winning a comparison is not the same as being worth buying.
What drives the choice
From these choices, Choicery estimates a utility for every feature level, for every single respondent (Hierarchical Bayes). Two views tell you most of what you need. First: how much each attribute moved the decisions.
Attribute Importance
- Price per month32.6%
- Data processing13.6%
- Video minutes per month12.7%
- Voiceover languages11.9%
- What you get11.5%
- When your software changes10.9%
- Contract6.8%
Price matters most, no surprise. More interesting is what comes second: where data is processed, ahead of minutes, languages and deliverables. The contract term matters least. People notice it, but it rarely decides.
Second: what each option is worth within its attribute.
Average Utilities
Price per month linear
−3.80 per €1 more
Contract
- Monthly, cancel anytime+11.2
- 12 months, billed monthly−2.5
- 12 months, paid upfront−8.7
Video minutes per month
- 15−47.0
- 60+13.3
- Unlimited+33.7
When your software changes
- You re-record manually−36.9
- Re-recorded automatically after every release+36.9
Voiceover languages
- English−38.0
- English and German+5.8
- English, German, French and Spanish+32.1
What you get
- Video−39.5
- Video and step-by-step guide+7.6
- Video, guide and interactive demo+31.9
Data processing
- USA−11.5
- EU+51.0
- Not specified−39.5
None option outside option
- No purchase−7.7
Zero-centered: within each attribute the levels add up to zero. Green helps a plan, red hurts it.
Price per month linear
−3.80 per €1 more
Contract
- Monthly, cancel anytime+19.9
- 12 months, billed monthly+6.2
- 12 months, paid upfront0.0
Video minutes per month
- 150.0
- 60+60.3
- Unlimited+80.7
When your software changes
- You re-record manually0.0
- Re-recorded automatically after every release+73.8
Voiceover languages
- English0.0
- English and German+43.8
- English, German, French and Spanish+70.1
What you get
- Video0.0
- Video and step-by-step guide+47.1
- Video, guide and interactive demo+71.4
Data processing
- USA+28.0
- EU+90.5
- Not specified0.0
None option outside option
- No purchase−7.7
Difference from the worst level of each attribute: how many utility points a plan gains by moving up from the weakest option.
Two things stand out. “Not specified” is almost as bad as a missing feature, worse than naming the USA. And the step from 15 to 60 minutes is bigger than the step from 60 to unlimited. Switch to “Diff from worst” to see how much each upgrade adds.
The upgrade is the work nobody wants to do
Utility points are hard to put on a pricing page. Euros are easier. Choicery offers three ways to turn the results into willingness to pay, and the choice matters:
- Pseudo-WTP divides a feature’s utility by the price coefficient. Quick, but it ignores competitors and the option to buy nothing.
- Simulation WTP raises the price of your improved plan until it loses exactly the share it gained, against competitors you define. Good when you know your competitors well.
- Robust WTP does the same in 300 randomly generated markets and reports the median with an interval. Choicery recommends it as the default.
You are about to launch and you do not know exactly which tools people will compare you with. That rules out Simulation WTP with one hand-picked market. Robust WTP is the honest choice: it asks what a feature is worth across many plausible markets, with “none of these” always on the table. Pick a change to the Starter plan:
Robust WTP (SOS)
€18.68
Median WTP for change (SOS)
You re-record manually Re-recorded automatically after every release
- 95% interval
- €16.85 to €20.77
- Across markets (P5 to P95)
- €14.62 to €22.43
−€14.12
Median WTP for change (SOS)
Data processed in the EU Data processed in the USA
- 95% interval
- −€15.96 to −€11.54
- Across markets (P5 to P95)
- −€17.11 to −€10.76
−€20.06
Median WTP for change (SOS)
Data processed in the EU Processing location not specified
- 95% interval
- −€22.50 to −€17.83
- Across markets (P5 to P95)
- −€24.60 to −€16.52
€17.36
Median WTP for change (SOS)
15 video minutes 60 video minutes
- 95% interval
- €15.29 to €19.58
- Across markets (P5 to P95)
- €14.57 to €20.65
€24.67
Median WTP for change (SOS)
15 video minutes Unlimited video minutes
- 95% interval
- €21.99 to €27.75
- Across markets (P5 to P95)
- €21.29 to €28.56
€10.29
Median WTP for change (SOS)
Video only Video and step-by-step guide
- 95% interval
- €8.48 to €12.25
- Across markets (P5 to P95)
- €5.83 to €13.25
€17.75
Median WTP for change (SOS)
Video only Video, guide and interactive demo
- 95% interval
- €15.94 to €20.05
- Across markets (P5 to P95)
- €15.00 to €20.10
€11.93
Median WTP for change (SOS)
English voiceover English and German
- 95% interval
- €10.02 to €14.15
- Across markets (P5 to P95)
- €6.03 to €16.25
€21.98
Median WTP for change (SOS)
English voiceover English, German, French and Spanish
- 95% interval
- €19.77 to €24.69
- Across markets (P5 to P95)
- €19.17 to €26.10
−€3.67
Median WTP for change (SOS)
Monthly, cancel anytime 12 months, billed monthly
- 95% interval
- −€4.95 to −€2.35
- Across markets (P5 to P95)
- −€6.51 to −€2.14
−€4.34
Median WTP for change (SOS)
Monthly, cancel anytime 12 months, paid upfront
- 95% interval
- −€5.99 to −€2.61
- Across markets (P5 to P95)
- −€6.23 to −€2.31
Automatic re-recording is worth €18.68 a month. That is your line between Starter and Pro: the upgrade takes recurring work off someone’s desk. (Pseudo-WTP would say €19.36. Close here, but that is not a given.)
Moving data processing from the EU to the USA would cost you −€14.12 a month in willingness to pay. Saying nothing at all costs −€20.06. So every plan says “processed in the EU”.
More minutes matter, but unevenly. Going from 15 to 60 minutes is worth €17.36, going all the way to unlimited €24.67. Unlimited adds only about seven euros on top of 60, so a top plan cannot live on minutes alone. A written guide adds €10.29, guide and interactive demo €17.75. German voiceover is worth €11.93, all four languages €21.98.
These are reference points for single changes. You cannot add them up to a guaranteed price.
“Two months free” gets to stay
The annual offer is the one thing you copied that survives.
Compared with a monthly plan you can cancel any time, a 12-month contract billed monthly costs −€3.67 a month in willingness to pay. Paying the year upfront: −€4.34.
At €49 a month that is about 9%. “Two months free” is about 17%, so it covers the difference comfortably. “One month free” (8%) would fall just short. You keep the offer, and now you know why.
Three plans, each with a job
Starter is the simple way in. Pro keeps your tutorials current and adds the written guide. Team adds all four languages, the interactive demo and unlimited minutes. Every plan says where data is processed.
| Included | Starter | Pro | Team |
|---|---|---|---|
| Per month | €19 | €49 | €79 |
| Video minutes | 15 | 60 | Unlimited |
| Re-recording | Manual | Automatic | Automatic |
| Voiceover | English | English and German | English, German, French and Spanish |
| Output | Video | Video and guide | Video, guide and interactive demo |
| Processing | EU | EU | EU |
Before you print them, you let the market simulator in Choicery play them against each other with the 400 respondents:
Choice Share
Share of Preference / +None
Pro takes 52.0%, Team 26.6%, Starter 12.4%, and 9.0% choose none. That is the shape you want: the middle plan carries the business, the top plan is more than decoration, and Starter is there for the cautious without swallowing the upgrades.
The 9.0% is lower than the 15% from the survey because this line-up is built from the features people value most. It is still a simulation, not a conversion rate.
Now you know what goes first
The new headline:
Tutorial videos that re-record themselves after every release
Below it, three short points: every video comes with a written step-by-step guide; data is processed in the EU and sensitive data is blurred automatically; and, on the German page, voiceover in German.
Image placeholder: the new landing page
A clean, simple landing page on a laptop screen: one big headline about tutorial videos that update themselves, three short bullet points below, a single button. The team from the first image is relaxed in the background.
File: /static/blog/saas-pricing/saas-pricing-landing-after.png
The plans have clear jobs, the annual offer stays, and the avatar moves down the roadmap. Whether people actually buy, you will only find out after launch. But you can now explain every line on the page and every price, without going back to anyone’s favourite demo moment.
Try it yourself
Both surveys are live: the feature survey (wave 1) and the pricing survey (wave 2). The guide to this example explains the setup step by step.
If your team keeps coming back to the same question, you can build both studies in Choicery.