Anchored MaxDiff: Best-Worst Scaling with Calibration
The manual of the Anchored MaxDiff editor: every step and control, the calibration settings and screen, recommended study sizes, the evidence on anchoring methods, and how a short calibration step turns relative best-worst scores into absolute ones. Worked example: the 20 pizza toppings of the Pizza (Example) study.
How to build, field, and analyse an Anchored MaxDiff study in Choicery.
1. What Is Anchored MaxDiff?
Anchored MaxDiff is ordinary MaxDiff (best-worst scaling) with one extra step. Respondents first work through best-worst tasks: each task shows a few items and asks for the best and the worst. After the last task, one calibration screen lists every item with a Yes/No question, for example "Would you consider actually choosing this topping for your pizza?". These answers place a fixed reference point, the anchor, on the same scale as the items.
Plain MaxDiff gives the rank order and the gaps between items, but no zero of "acceptable": the best item wins even if nobody wants any of them. The anchor fixes that zero, so you can read whether an item lies above the line (wanted) or below it.
The Pizza study used throughout this guide
The Anchored MaxDiff block of the Pizza (Example) study scores the same 20 toppings as the plain MaxDiff block: Pepperoni, Mushrooms, Extra mozzarella, Fresh basil, Ham, Pineapple, Black olives, Red onions, Bell peppers, Italian sausage, Bacon, Spinach, Sun-dried tomatoes, Anchovies, Jalapeños, Prosciutto, Artichoke hearts, Grilled chicken, Salami and Arugula. The columns are labelled "Most preferred", "Toppings" and "Least preferred". Each task shows 4 toppings; the design has 200 versions of 8 tasks.
The best-worst part is identical to plain MaxDiff. The MaxDiff guide covers the same editor; this guide repeats everything you need and adds the calibration.
What you get out of it
Individual item utilities for every respondent, as in plain MaxDiff.
An individual anchor threshold, estimated on the same scale.
P(Accept) per item: the share of respondents who would accept it, and consideration sets per respondent.
The usual views: preference ranking, segmentation and TURF reach.
2. When to Use It (and When Not)
Use Anchored MaxDiff when a rank order is not enough and you need to know which items clear a line of real acceptance. If you only need to prioritise, plain MaxDiff is shorter for respondents and fully sufficient.
Situation
Use
Rank a list of items by preference or importance
MaxDiff (unanchored)
Decide which items are wanted and which are not
Anchored MaxDiff
Find the smallest set of items that most people accept
Anchored MaxDiff + TURF
Choose one product from competing multi-attribute profiles
CBC Traditional
Also need "would you buy at all?" for a product
DR-CBC (dual response)
The cost of anchoring
Anchoring adds one screen and one assumption: that the Yes/No line is a stable point people apply consistently. Orme (2020, ch. 12.6) doubts that any anchor is truly absolute: "important" is read differently by different people, the country shifts the anchor, and yea-saying can return. Add the anchor when the absolute reading drives a decision.
3. Opening the Editor
The editor is the Anchored MaxDiff Configuration page. You reach it from the Survey Flow:
1
New block: in the Add Item panel on the right of the Survey Flow, open the section Conjoint and click or drag Anchored MaxDiff () into the flow. The block gets a free default task name (anchored_maxdiff_task, or a numbered variant).
2
Existing block: click Edit on the Anchored MaxDiff card, or click its row in the list view. Each block has its own items, calibration texts and design.
The left rail
Setup: General (opens first, including the Calibration Settings), Attributes (the item list), Layout.
Templates: Templates.
Output: Generate, Preview.
Help: Anchored MaxDiff Guide opens this guide in a new tab.
Required before fielding: the item list, the calibration wording (pre-filled, but you should adapt it) and a generated design. Layout and Templates are optional.
What saves automatically and what needs Save changes
Step
How it is saved
General (with Calibration Settings)
Manually with Save changes. Status pill Saved, Unsaved changes or Saving...; leaving with unsaved changes asks for confirmation. A design cannot be generated while General is unsaved ("Save General Settings before generating the design.").
Attributes
Automatically, about 0.8 seconds after you stop typing (Autosaved, Saving..., Save failed, Resolve duplicate attributes).
Layout
Manually with its own Save changes.
Templates, Generate
Act immediately on Save, Apply or Generate Design.
The two locks
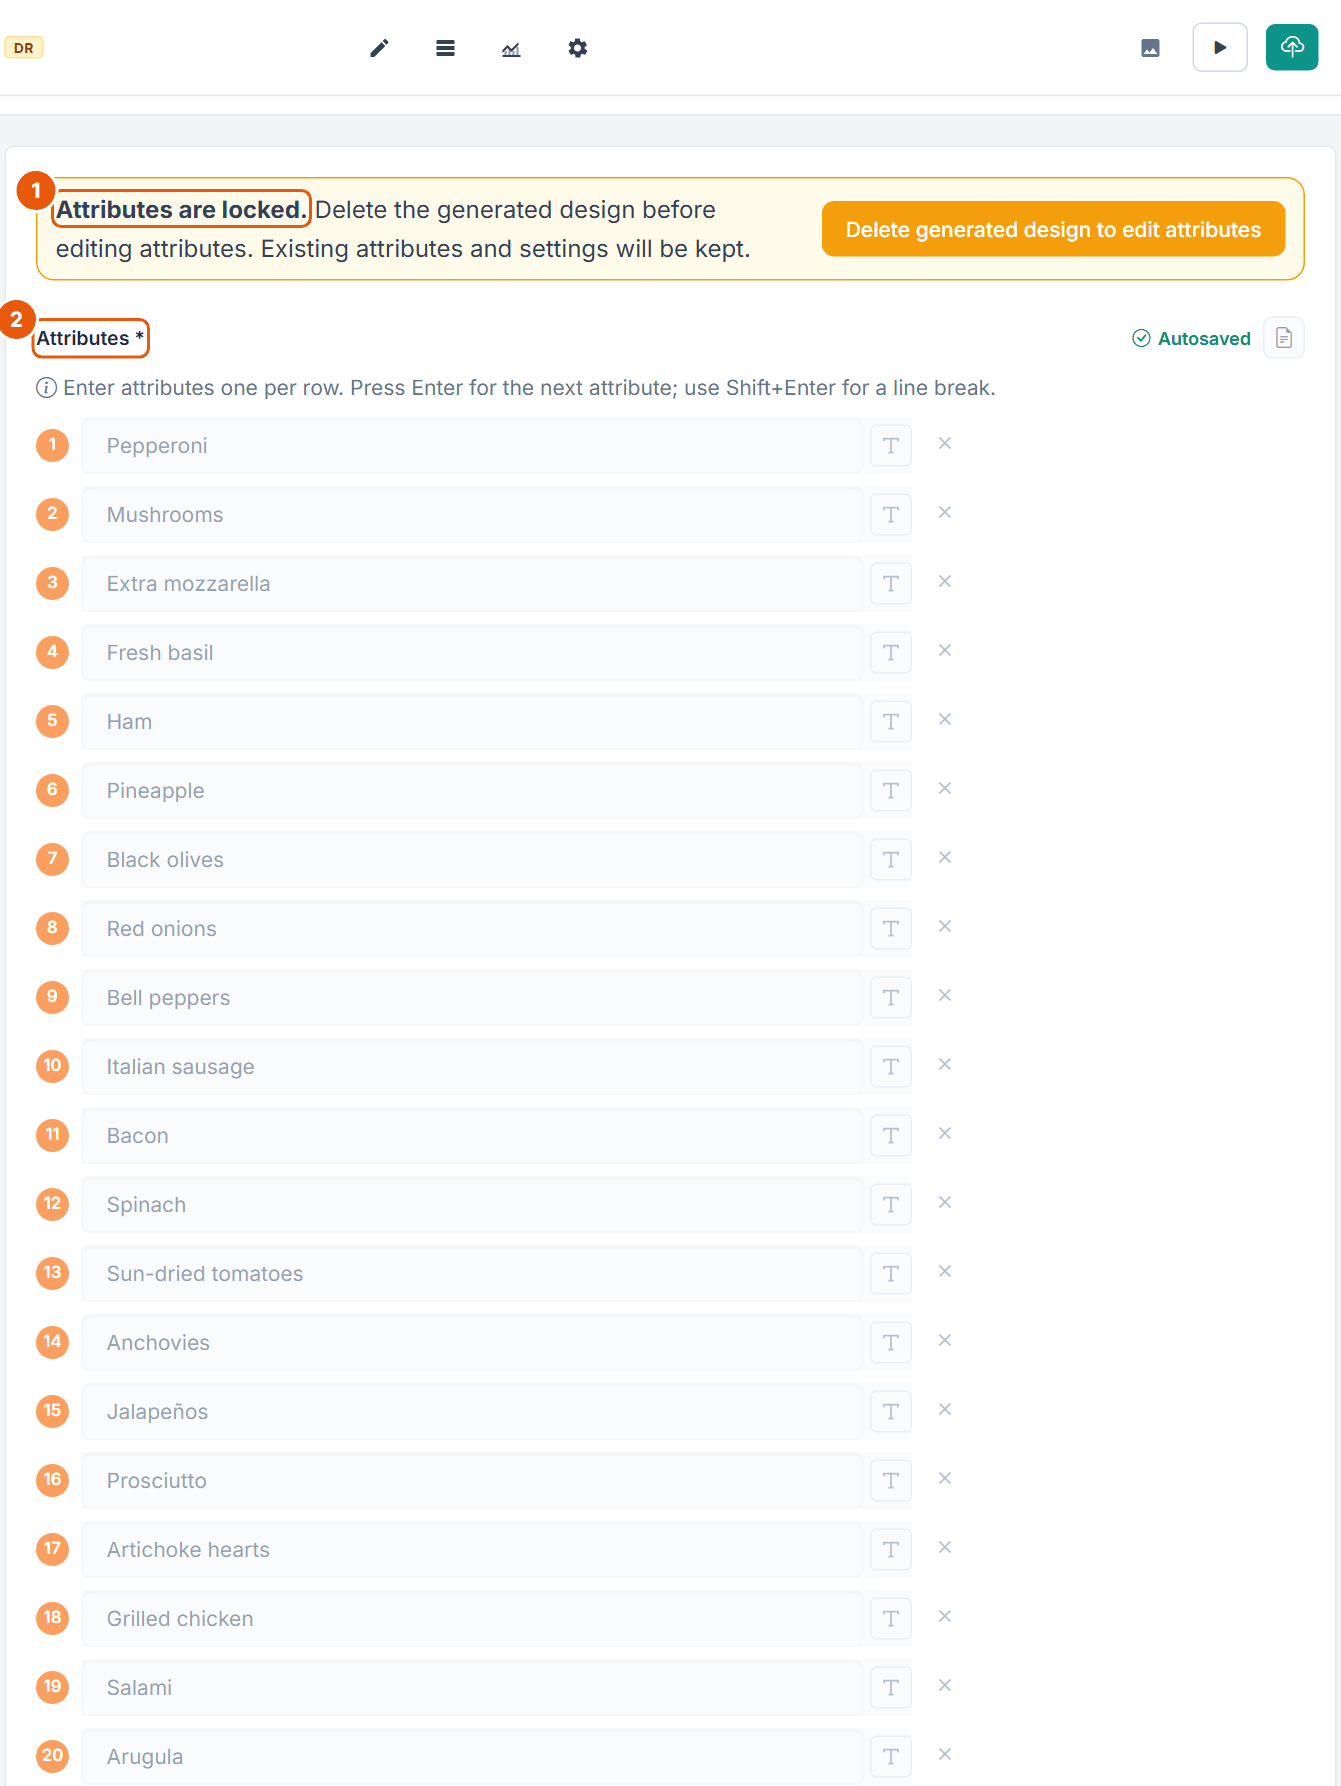
Item list locked once a design exists: "Attributes are locked. Delete the generated design before editing attributes. Existing attributes and settings will be kept." with the button Delete generated design to edit attributes (Figure 2).
Whole design locked once responses exist: the banner "Design locked - responses already collected" names the active and trashed responses and says: "To modify the design, open Data → Bin and permanently delete all responses first. To preserve them, duplicate the project before making changes. Preview, downloads, and design diagnostics remain available while the design is locked." All editing controls, including the calibration texts, are then disabled.
If the item list and the design no longer match, a Design Warning at the top says so (for example "Design is missing N item(s) from your current configuration. Please regenerate the design.").
4. The Editor Step by Step
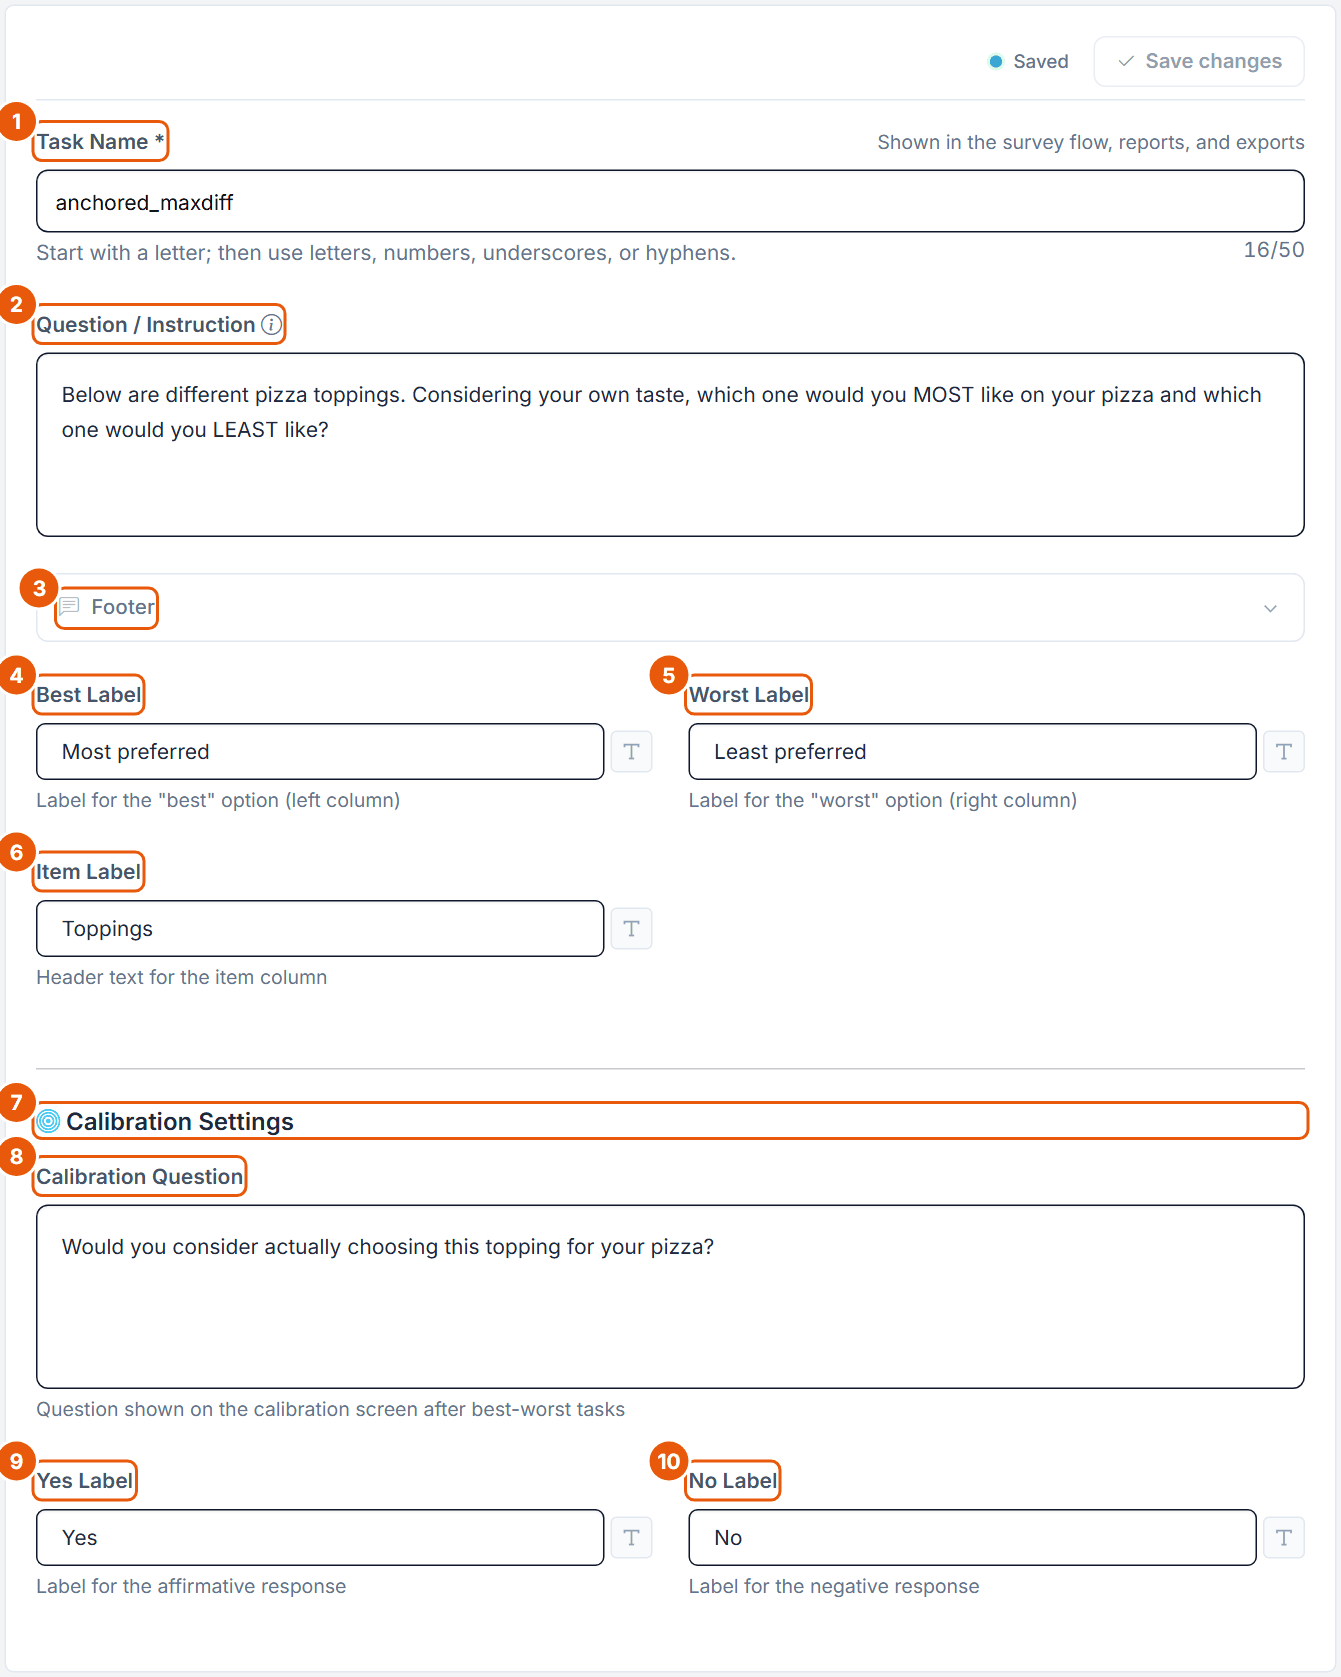
4.1 General and Calibration Settings
Figure 1. The General step of the Pizza Anchored MaxDiff block, with the Calibration Settings at the bottom.
No.
Control
What it does
1
Task Name *
Required. Shown in the survey flow, reports and exports (export columns start with anchored_maxdiff_ plus this name; the calibration answers get the suffix _cal). Up to 50 characters, starting with a letter, then letters, numbers, underscores or hyphens. Pizza: anchored_maxdiff.
2
Question / Instruction
The text above every best-worst task (rich text, up to 10,000 characters and 10 images). Default "Please select the best and worst item."
3
Footer
Optional text below each task. It also appears below the calibration screen.
4
Best Label
"Label for the "best" option (left column)". Default "Best"; Pizza "Most preferred". Required, up to 1,000 characters, no images.
5
Worst Label
"Label for the "worst" option (right column)". Default "Worst"; Pizza "Least preferred". Same rules.
6
Item Label
"Header text for the item column". Default "Item"; Pizza "Toppings". Also the header of the calibration list.
7
Calibration Settings
The block that makes the study anchored. Always visible on General.
8
Calibration Question
"Question shown on the calibration screen after best-worst tasks". Default for a new block: "Would you consider purchasing or using this item?"; Pizza: "Would you consider actually choosing this topping for your pizza?". Rich text, up to 10,000 characters and 10 images. If you clear it, the previously saved question is kept.
9
Yes Label
"Label for the affirmative response". Default "Yes". Required: an empty label blocks the save ("Anchor yes label is required."). Up to 1,000 characters, no images.
10
No Label
"Label for the negative response". Default "No". Required ("Anchor no label is required.").
Writing a good calibration question
The question defines the line. Make it a clear, absolute Yes/No judgment that every respondent reads the same way and that matches your decision. The Pizza question asks about an actual choice ("would you consider actually choosing"), not about liking. Avoid comparisons ("better than average?"): they bring back the relativity the anchor is meant to remove. Schramm and Lichters (2024, p. 5) advise framing the task as purchase likelihood when you need buy or no-buy predictions.
4.2 Attributes: the item list
The step is labelled Attributes and the list "Attributes *", but each row is one item. The same list appears on the calibration screen.
Figure 2. The item list of the Pizza block, locked because a design exists. The orange numbers 1 to 20 are the editor's row numbers, not markers.
No.
Control
What it does
1
Attributes are locked.
Shown once a design exists. Delete generated design to edit attributes deletes the design after a confirmation; items and settings stay. Not possible while responses exist.
2
Attributes *
The item list ("Enter attributes one per row. Press Enter for the next attribute; use Shift+Enter for a line break."). T opens formatting, × removes a row. Right of the label: autosave status and the TXT import.
Below the list: Add Attribute and the counter "N attributes".
Rule
What Choicery does
TXT import
"Import from TXT file (one attribute per line)". Replaces the whole list and saves at once ("Imported N attributes from file.").
Duplicates
Blocked, ignoring capitalisation and formatting: "Duplicate of rows X, Y (capitalization and formatting are ignored)."
Length and images
Up to 1,000 characters and 1 image per item.
Number of items
At most 100. To generate a design, you need at least 4 items: the smallest task shows 3, and at least one item must be left out. With the default 4 Items per Task, you need at least 5 items.
Free
At most 8 items, 4 items per task and 6 tasks per block.
4.3 Layout
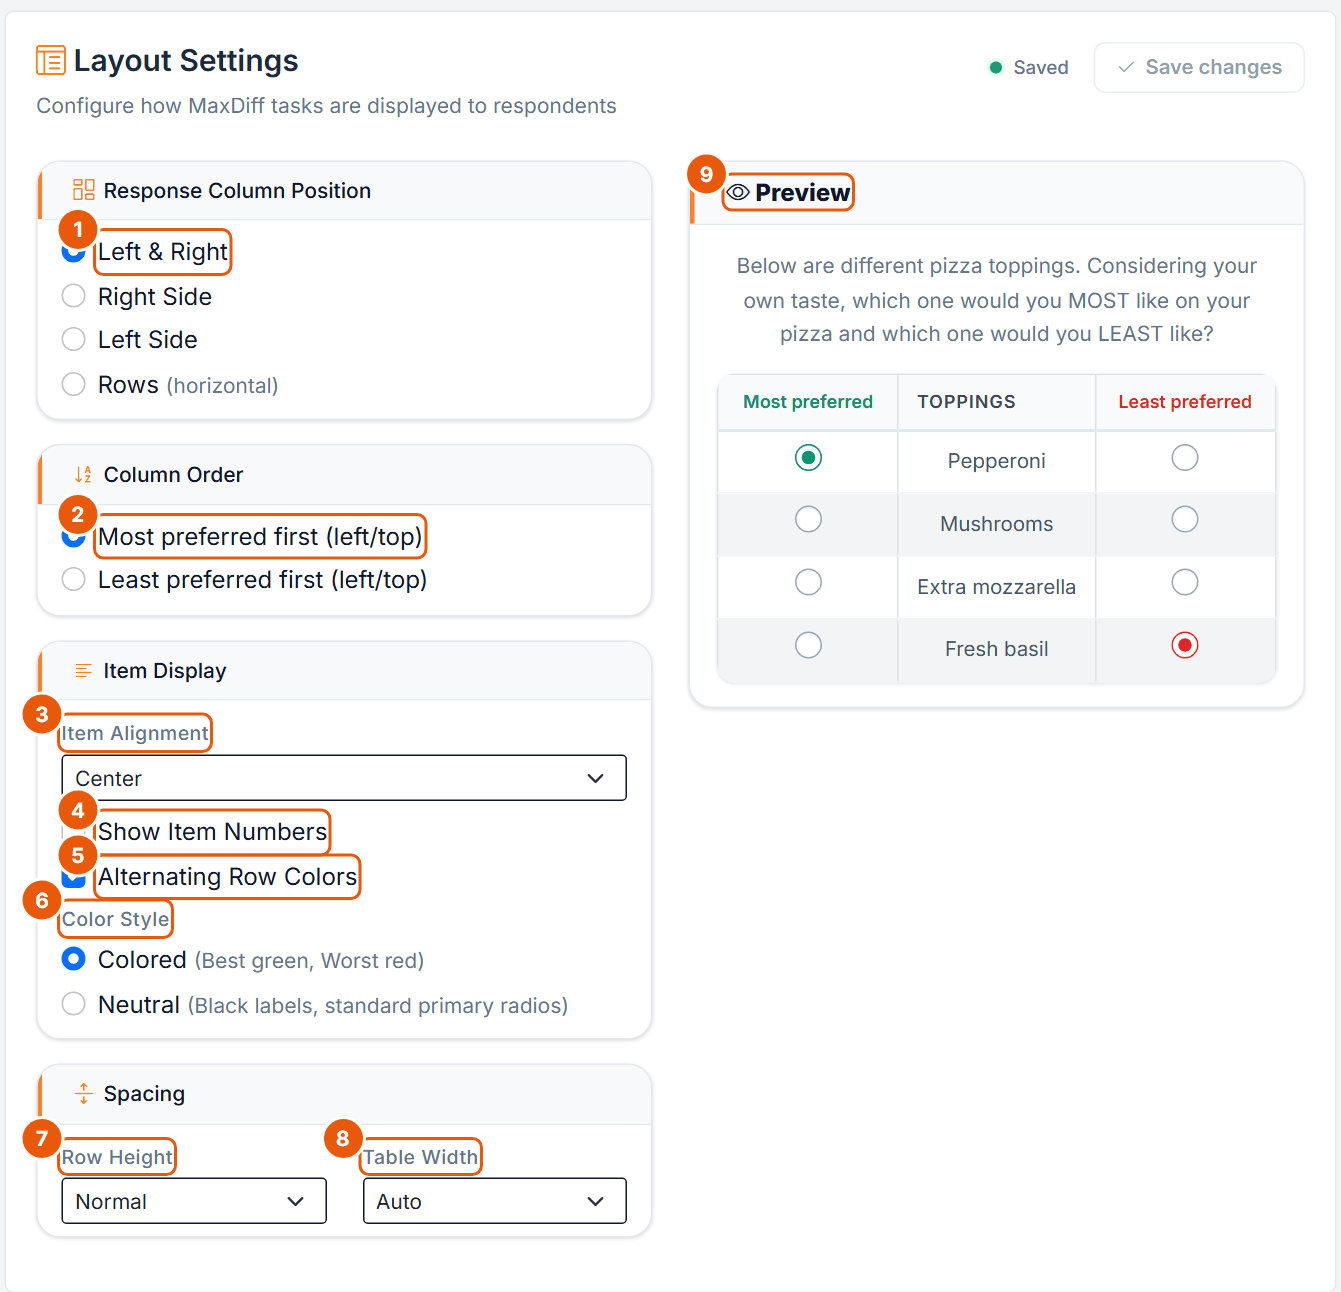
Figure 3. Layout Settings of the Pizza block: items centred, alternating row colours on. The Column Order options use the labels "Most preferred" and "Least preferred".
No.
Control
What it does
1
Response Column Position
Left & Right (default), Right Side, Left Side or Rows (horizontal: items as column headers, a best row and a worst row below; Item Label not used).
2
Column Order
Best label first (default) or Worst label first, left or top.
3
Item Alignment
Left (default), Center or Right.
4
Show Item Numbers
Numbers the items in the task. Off by default.
5
Alternating Row Colors
Shades every second row. Off by default; on in Pizza.
6
Color Style
Colored (default, best green, worst red) or Neutral (black labels, standard radio buttons).
7
Row Height
Compact, Normal (default) or Spacious.
8
Table Width
Auto (default) or Custom with Custom Width (%) 30 to 100 in steps of 5 (default 80).
9
Preview
Live preview of the task with the first four items.
Layout applies to the best-worst tasks. The calibration screen has its own fixed layout (section 6). Click Save changes after editing.
4.4 Templates
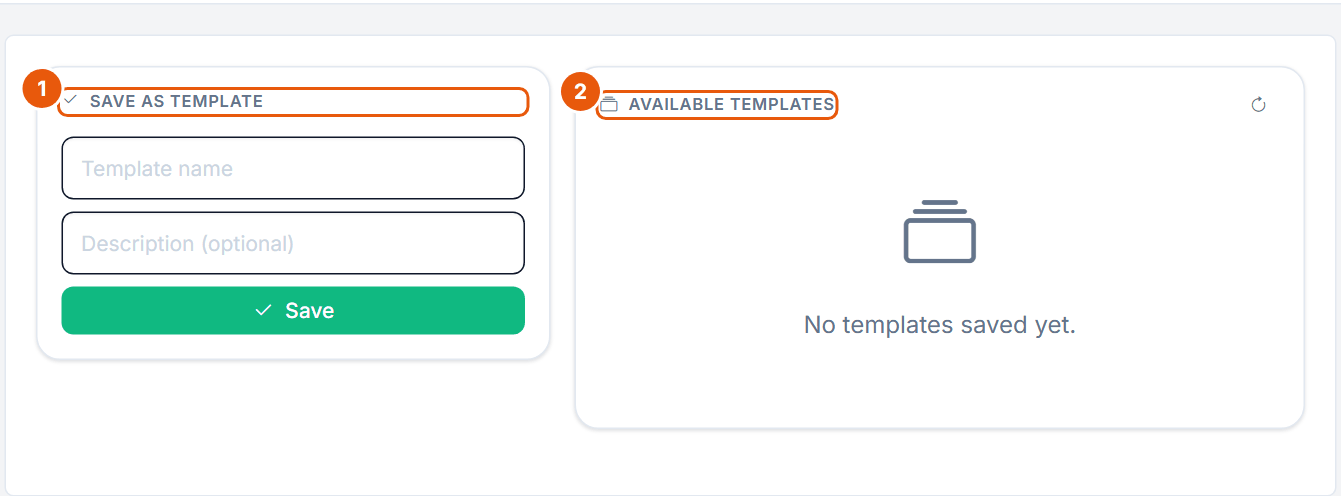
Figure 4. The Templates step.
No.
Control
What it does
1
Save as Template
Template name (required), Description (optional), Save (needs at least one item).
2
Available Templates
Saved templates with Apply, download as .txt, rename and delete; the button reloads the list.
A template stores the whole block configuration: items, question, footer, labels, layout and the Calibration Question, Yes Label and No Label, but not the design. Templates belong to your account. Apply is blocked while a design exists ("Delete the generated design before applying a template.") and replaces the current configuration after confirmation.
4.5 Generate
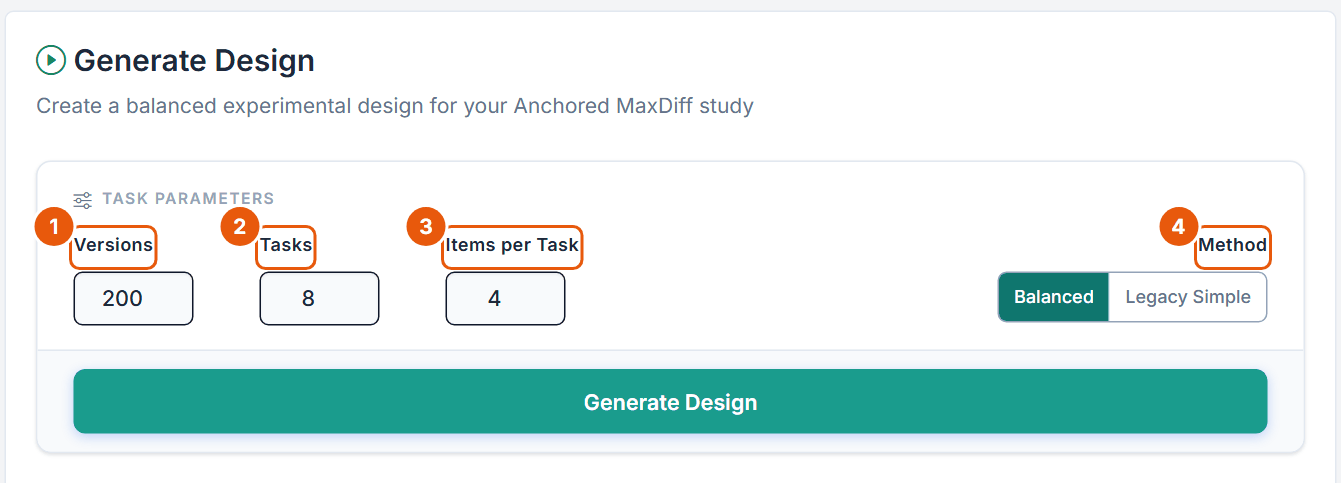
Header "Generate Design", subtitle "Create a balanced experimental design for your Anchored MaxDiff study". The calibration needs no design of its own: it always lists every item of the design once.
Figure 5. The Task Parameters card before generation (200 versions, 8 tasks, 4 items per task).
No.
Control
What it does
1
Versions
Number of different task sets; respondents are assigned in rotation. Default 200, allowed 1 to 300. Disabled for Legacy Simple.
2
Tasks
Best-worst tasks per respondent, before the calibration screen. Default 8 (Free plan 6), allowed 1 to 30.
3
Items per Task
Default 4, allowed 3 to 8, and at most the number of items minus 1. Free plan at most 4.
4
Method
Balanced (default): many versions, optimised item, pair, per-version and position balance. Legacy Simple: one fixed task set for everyone.
The readiness box above the form explains a disabled Generate Design button: Attributes required. (too few items for the chosen Items per Task), Design parameters required. (Items per Task outside 3 to 8), or the warning Limited task-set variation. when each task omits only one item. Generation saves pending item edits, needs a saved General step, asks "Replace existing design?" before replacing a design (the old one is backed up), is refused while responses exist, and can be cancelled from the progress panel.
Balanced makes item counts equal when versions × tasks × items per task is divisible by the number of items (otherwise they differ by at most one), then balances pairs, versions and screen positions. Legacy Simple builds one task set by rotating the least-used items. Details are in the MaxDiff guide.
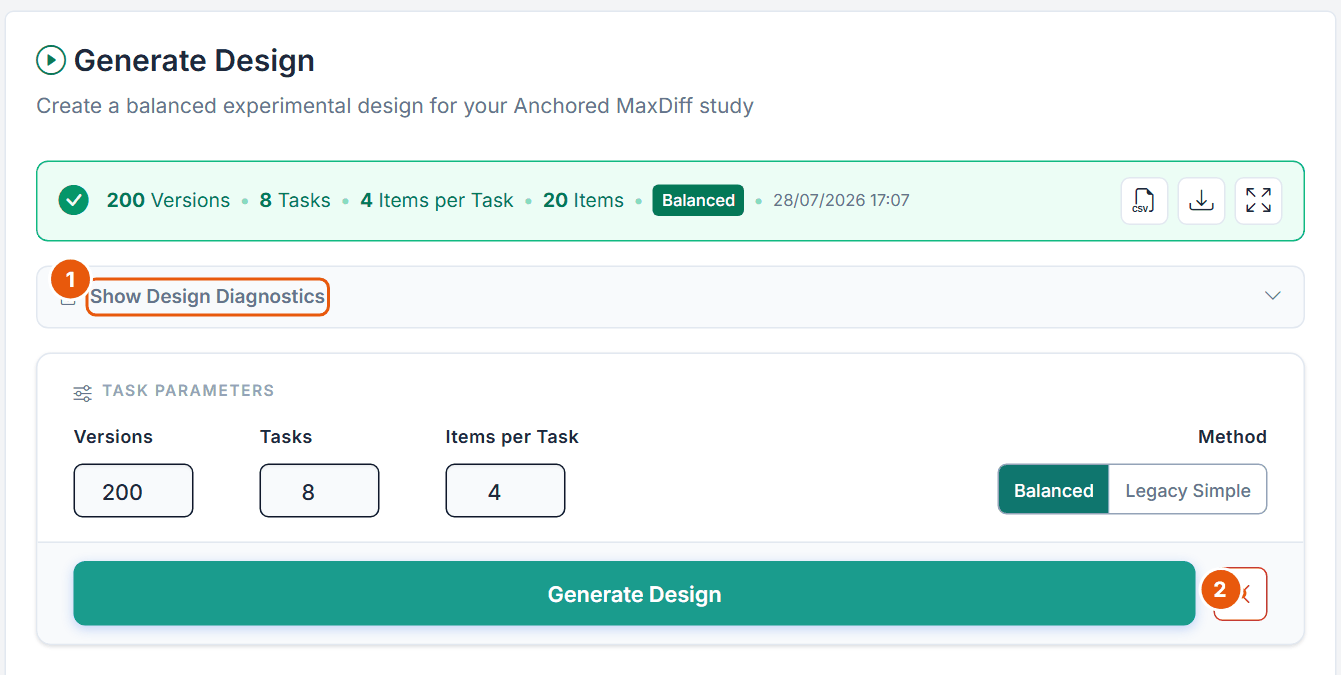
Figure 6. After generation: 200 Versions, 8 Tasks, 4 Items per Task, 20 Items, Balanced.
No.
Control
What it does
1
Show Design Diagnostics
Opens the inline diagnostics summary (section 4.6).
2
Delete design
Deletes the design after "Delete generated design?". Disabled while responses exist.
The status bar icons are Download Design CSV, Download Diagnostics (text report) and Full Diagnostics.
4.6 Design Diagnostics
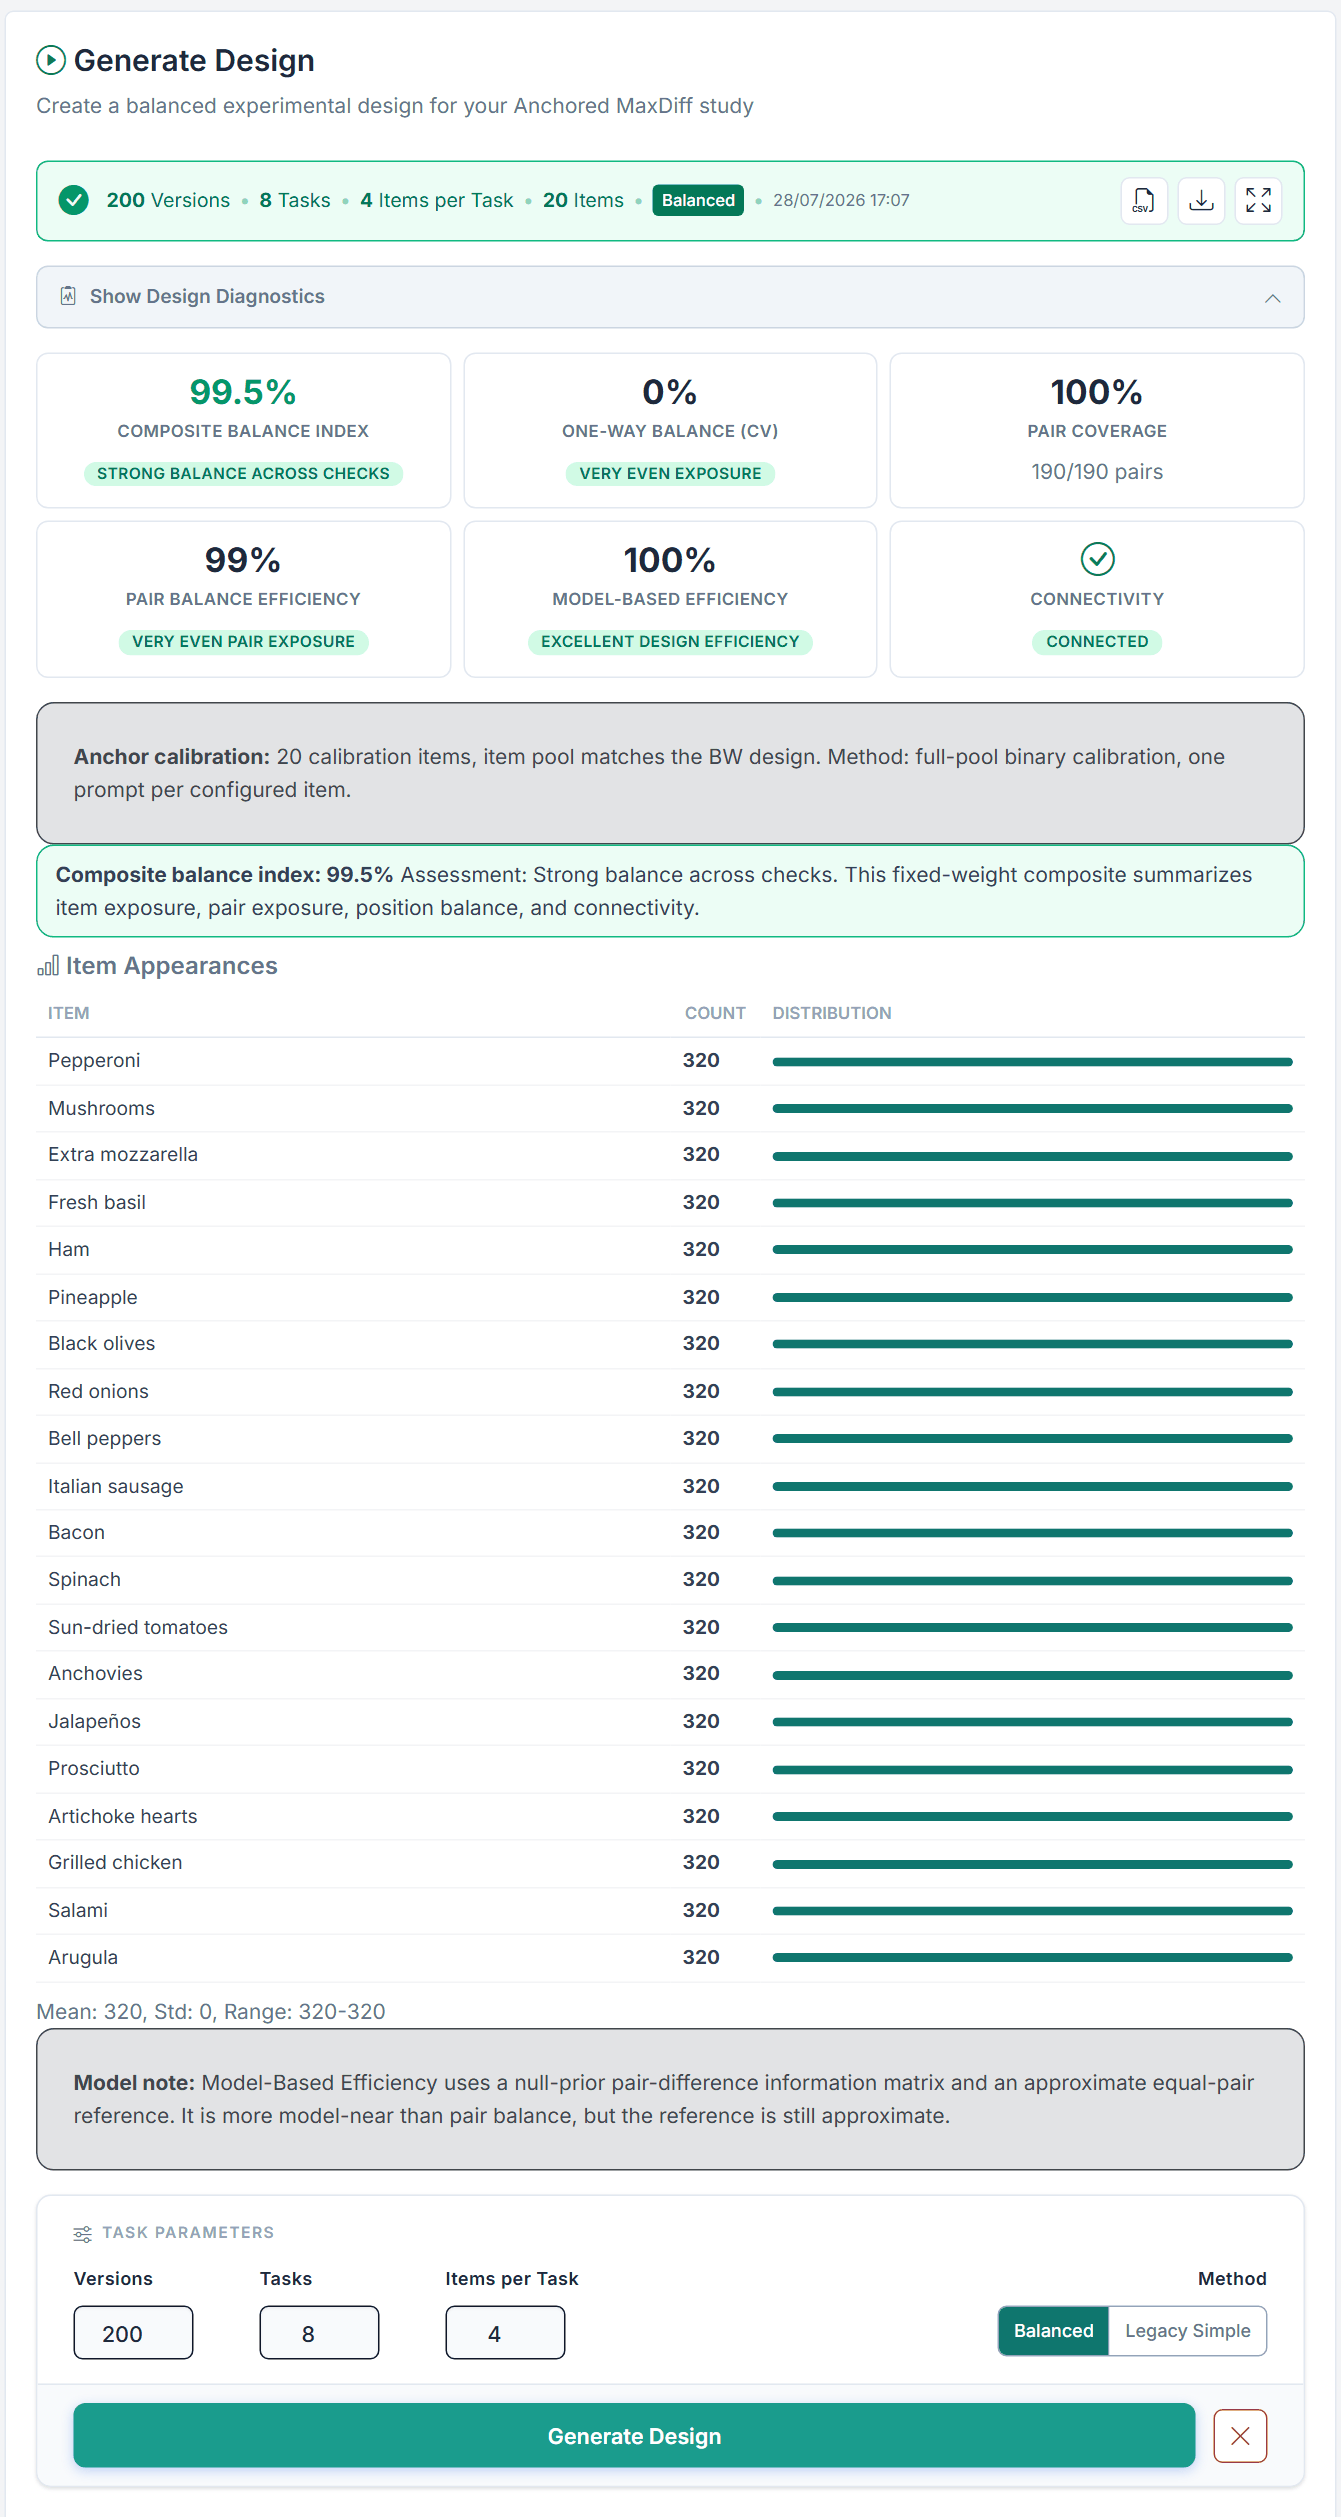
Figure 7. Inline diagnostics of the Pizza design: Composite Balance Index 99.5 percent, One-Way Balance (CV) 0 percent, Pair Coverage 100 percent (190/190 pairs), Pair Balance Efficiency 99 percent, Model-Based Efficiency 100 percent, Connected. Each topping appears 320 times (200 × 8 × 4 / 20). The grey box reads "Anchor calibration: 20 calibration items, item pool matches the BW design."
The tiles mean the same as in plain MaxDiff:
Measure
What it means
Target
Composite Balance Index
Fixed-weight summary of item exposure, pair exposure, position balance and connectivity.
High; read the parts.
One-Way Balance (CV)
Variation of item appearance counts; 0 percent = perfectly equal.
Below 5 Excellent, below 15 Good.
Pair Coverage
Share of item pairs that appear together at least once.
100 percent; recommendation below 80.
Pair Balance Efficiency
How evenly pairs co-occur.
Recommendation below 70.
Model-Based Efficiency
Information for item differences relative to Choicery's balanced reference.
Recommendation below 70; "Unavailable" means rank deficit.
Connectivity
All items linked through shared tasks.
Must read Connected.
The full diagnostics page adds Per-Version Exposure, Positional Balance, the pair matrix, Design Information and Recommendations, plus the section Anchor Calibration: Method "Full-pool binary", Calibration Items, BW Design Items, Item Pool Match, Prompts / Version, Order (Randomized), and a table per item with In BW, In Calibration, BW Exposures, Anchor Prompts and Anchor/BW. Its caption: "Anchored MaxDiff uses the generated best-worst design, then shows one binary calibration prompt for each configured item. The anchor threshold is estimated after HB analysis from these Yes/No responses." Warnings appear for an empty calibration pool, an item pool that does not match the design, or a blank question or label.
4.7 Preview
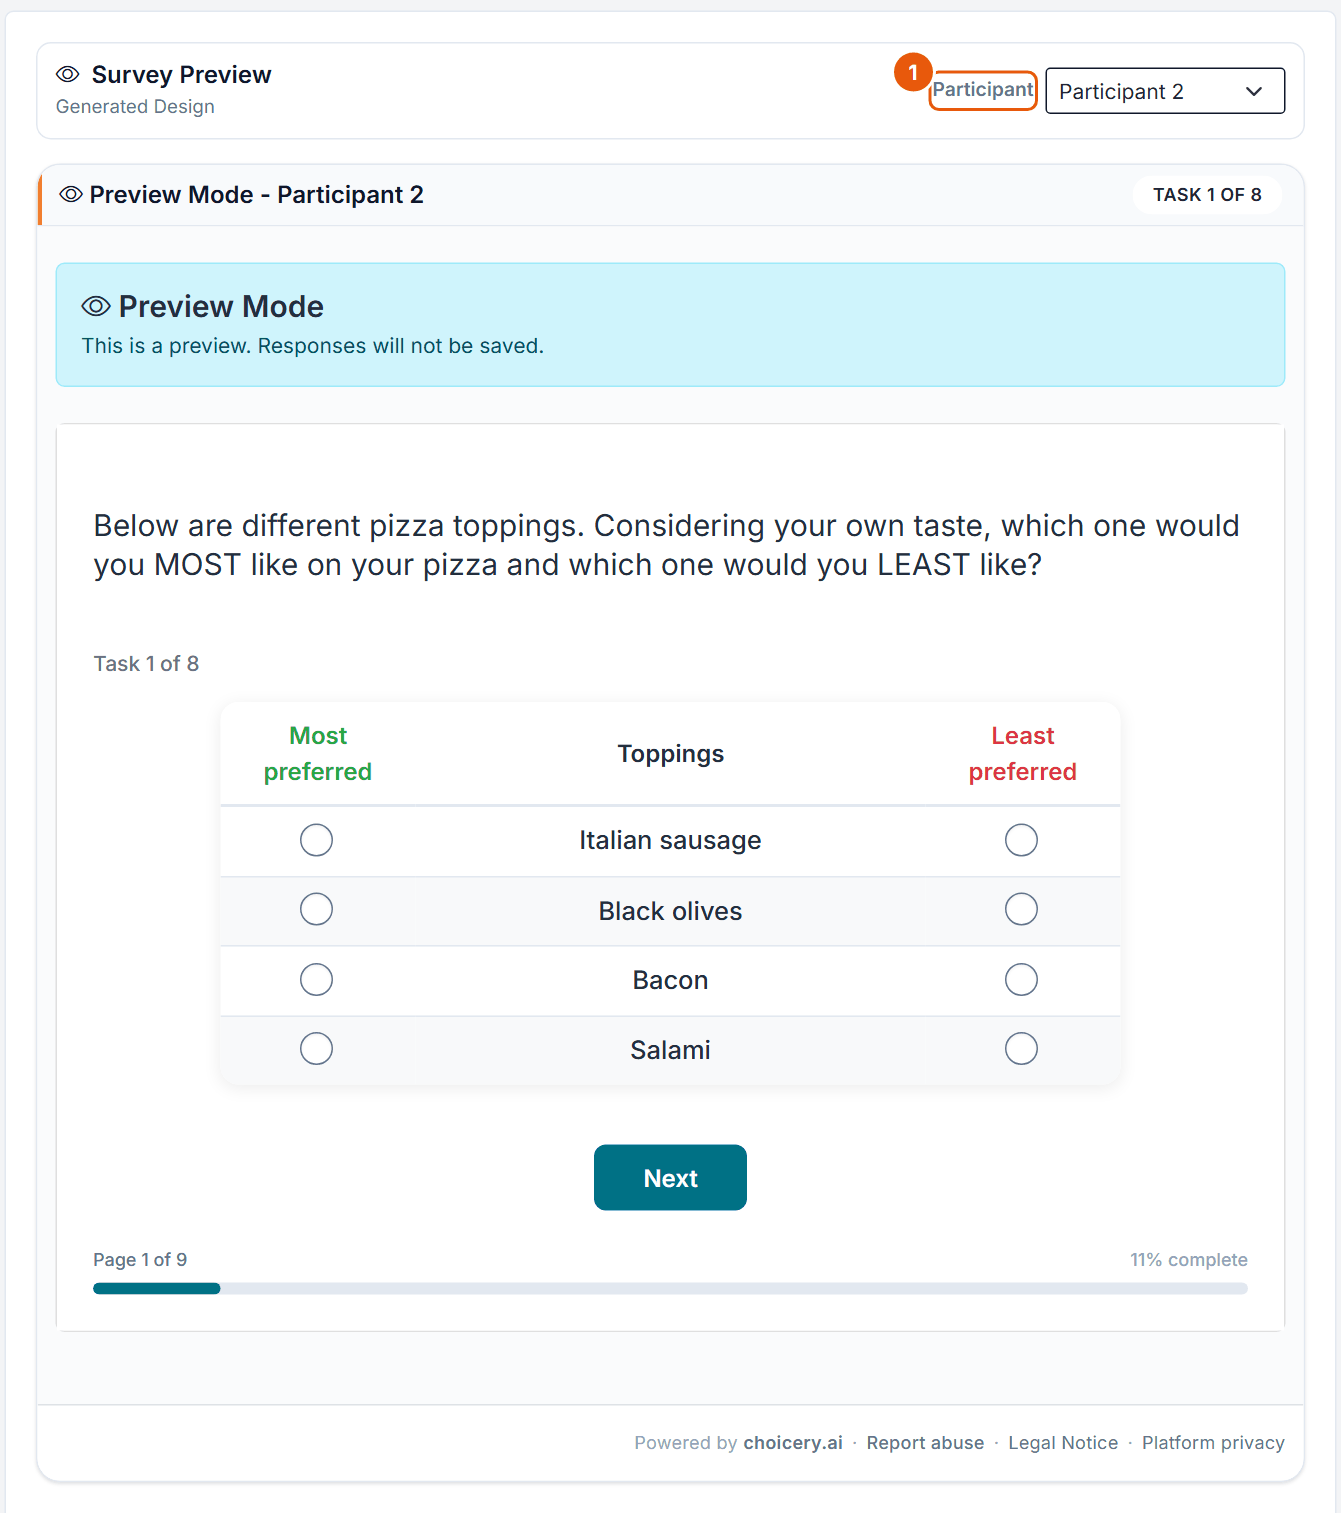
Figure 8. Preview of Participant 2, task 1 of 8 (Italian sausage, Black olives, Bacon, Salami). "Page 1 of 9": 8 tasks plus the calibration screen.
No.
Control
What it does
1
Participant
Picks the design version. The preview steps through all tasks and then a final Calibration step, ending with "Preview complete - All MaxDiff and calibration steps were completed." Answers are not saved.
Without a design, the Example Preview shows one task built from the first items and no calibration screen.
5. How Large Should Your Study Be?
The best-worst part follows the same rules as plain MaxDiff. The calibration adds one Yes/No per item, so a long list also makes the calibration screen long.
Setting
Recommendation
Source
Choicery allows
Items in the list
Typically 8 or more; no maximum stated for HB MaxDiff
Orme (2020), ch. 12.2, p. 119
3 to 100 (Free plan 8)
Items per task (k)
4 to 5
Orme (2020), p. 119 (4 to 6); Rao (2026), p. 525 (3 to 5); Schramm & Lichters (2024), p. 2 (3 to 4)
3 to 8, default 4
Appearances per item
About 3: tasks = 3 × K / k
Rao (2026), p. 525 (worked example)
follows from Tasks and Items per Task
Tasks
8 to 20; median in business research 12 to 13
Orme (2020), p. 119; Schramm et al. (2025), p. 11
1 to 30, default 8 (Free plan 6)
Versions
Many, ideally one per respondent
Schramm et al. (2025), pp. 12, 37
1 to 300, default 200
Calibration items
Show all items in the direct anchor question
Schramm et al. (2025), p. 39
always all design items
Respondents
No MaxDiff-specific rule; anchoring studies used 448 and 1,468
Schramm & Lichters (2024); Schramm et al. (2025)
no limit in the editor
Table 1. Recommended Anchored MaxDiff sizes and the Choicery limits.
The Pizza study in numbers
K = 20, k = 4: about 3 appearances need 3 × 20 / 4 = 15 tasks (or 12 tasks with 5 items per task). The Pizza example uses 8 tasks, so each respondent sees each topping about 1.6 times; the design as a whole is perfectly balanced (320 appearances per topping, Figure 7). Schramm et al. (2025) found that direct anchoring, the method Choicery uses, reaches its best prediction with fewer tasks than the other anchors; for individual-level results 12 to 15 tasks are still the safer choice. The calibration screen then adds 20 Yes/No rows; in Schramm et al. (2025, p. 26) the direct anchor question took a median of 40 seconds.
tasks needed = 3 x K / k = 3 x 20 / 4 = 15
calibration rows = K = 20 (always all items)
Many items
With at most 30 tasks and 8 items per task, about 3 appearances per item are possible for up to 80 items (8 per task), 50 items (5 per task) or 40 items (4 per task). For longer lists Orme (2020, ch. 12.7) describes Sparse MaxDiff (each item about once, about 1,000 respondents, aggregate analysis) and the adaptive Bandit MaxDiff (80 to 500 items). Choicery has no adaptive design; a sparse design can be built with Balanced, but individual scores from it lean heavily on the HB population model. In Anchored MaxDiff a long list also means a long calibration screen with one row per item.
Sample size
The literature reviewed gives no sample-size rule for MaxDiff; the question is not settled. As orientation: Schramm and Lichters (2024) used 448 respondents in a 2 × 2 experiment, Schramm et al. (2025) 1,468. Plan each reported subgroup as its own sample.
Anchoring methods and their evidence
Method
How it works
In Choicery
Direct anchor (Lattery, 2010)
After all sets, show all items (or a subset) and ask for each whether it is important or would be bought.
Used. One screen after the last best-worst task of the block, all design items in random order, Yes/No per item, every row required.
After each set, ask whether all, some or none of the shown items are important or would be bought. Orme (2020, pp. 185 to 186) advises not more than 4 items per set with this method.
Not offered.
Status-quo anchor
A "would not buy any" alternative inside each set.
Not offered.
Limit card
A new anchor tested by Schramm et al. (2025).
Not offered.
Table 2. Anchoring methods (Orme, 2020, ch. 12.6, pp. 127 to 128; Schramm & Lichters, 2024, p. 5; Schramm et al., 2025, pp. 8 to 9).
Schramm and Lichters (2024), a preregistered 2 × 2 experiment (n = 448, 16 games, 16 sets of 4): incentive alignment raised predictive validity whichever anchor was used. Hit rates over three validation tasks: direct anchor 63.7 percent (incentive-aligned) vs 46.1 percent (hypothetical); indirect anchor 66.4 vs 50.5 percent. Direct and indirect anchoring had comparable predictive validity. Hypothetical MaxDiff overestimated demand. The indirect anchor gave a much higher no-buy probability, partly because most answers were the middle option "some"; the direct anchor predicted larger consideration sets (Table 1, p. 9; pp. 10 to 12).
Schramm, Lichters and Guhl (2025), a preregistered, incentive-aligned study (n = 1,468, 16 chocolates, 16 sets of 4). It is an SSRN preprint, not peer reviewed. The status-quo anchor predicted free and forced product choice best; the indirect anchor predicted consideration-set size and dual-response tasks best; the limit card was best for rankings but worst for free choice; the direct anchor needed the fewest tasks to reach its best prediction. "None of the anchor approaches is an 'all-rounder'." With the direct anchor, show all items, not a subset. For MaxDiff sections longer than about 2 minutes they suggest considering status-quo or indirect anchoring (pp. 2, 20 to 21, 34 to 40).
Orme (2020, ch. 12.6) questions whether any anchor is absolute and comparable across people.
What this means for your study
Direct anchoring, as Choicery implements it, is quick to answer and needs relatively few tasks. It is not the best predictor for every goal: for free product choice the status-quo anchor did better in one preprint study. Anchored results are comparable to a buy or no-buy line, but not perfectly absolute. Real incentives improve validity with any anchor.
6. What the Respondent Sees
First the best-worst tasks, exactly as in plain MaxDiff (Figure 8): question, "Task N of 8", the table, footer, Next. Back is disabled within the tasks. The respondent marks one item in each column; missing or identical picks are reported with the same messages as in MaxDiff, using your labels.
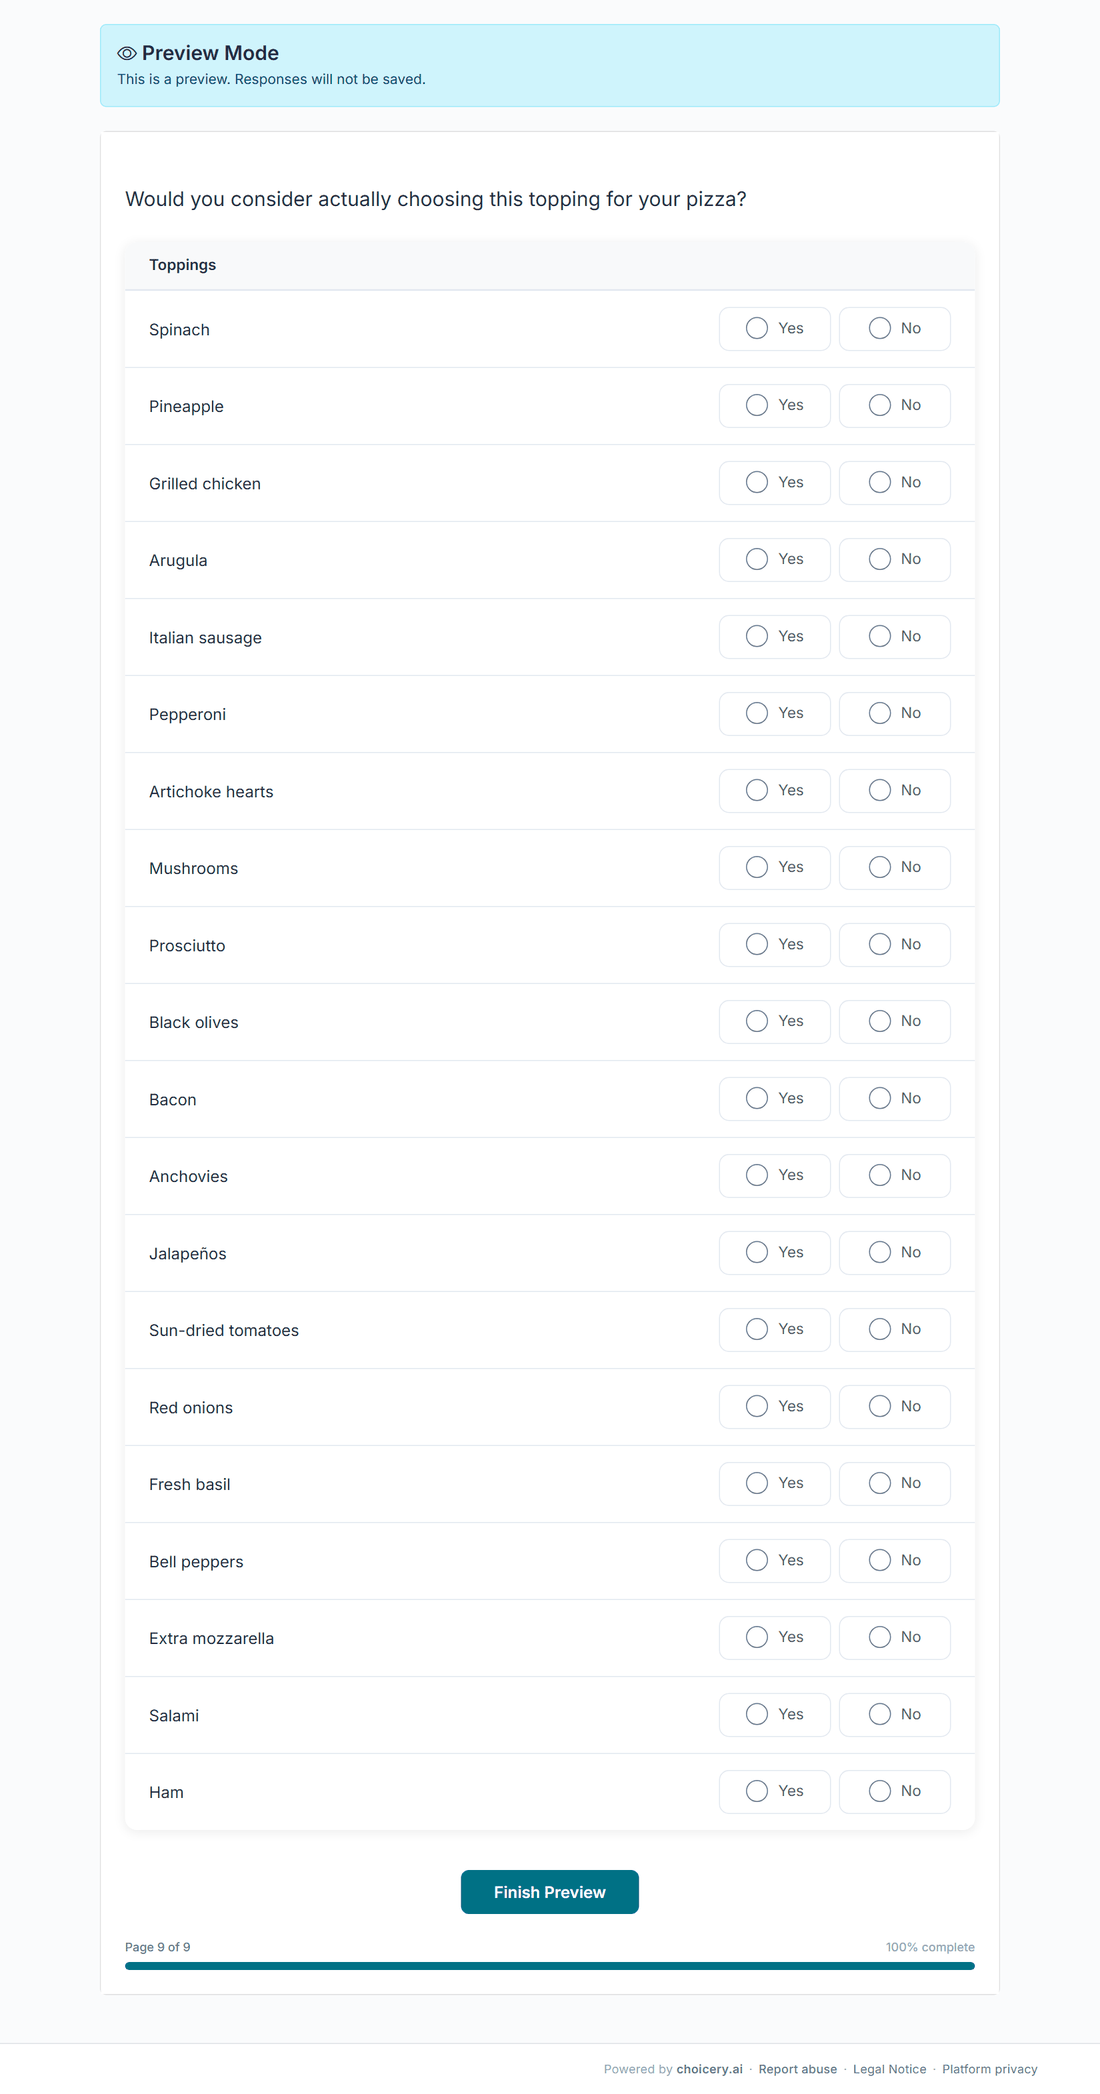
After the last task of the block comes the calibration screen:
The Calibration Question at the top.
Every item of the block's design once, in a random order fixed per participant (seeded by the participant number).
For each item two options: the Yes Label and the No Label. The list header shows the Item Label.
Every row must be answered: "Please answer all items. {count} item(s) remaining."; missing rows are highlighted.
The block footer below the list; no Back button.
Figure 9. The calibration screen of the Pizza study (preview): the Calibration Question, the Item Label "Toppings" as header and all 20 toppings in random order, each with the Yes and No labels.
A Yes places an item above the respondent's line, a No below it. The best-worst choices set the spacing of the items; the calibration answers pin the scale to a fixed point. Both are stored with the response and enter estimation together.
7. Estimating Utilities with Hierarchical Bayes
Open the analysis, select the Anchored MaxDiff task and use MaxDiff Preference Estimation (HB) on the Preference Analysis (HB) tab. It is the MaxDiff HB engine; the calibration answers enter the likelihood as extra observations, so the anchor threshold is estimated on the same scale as the items.
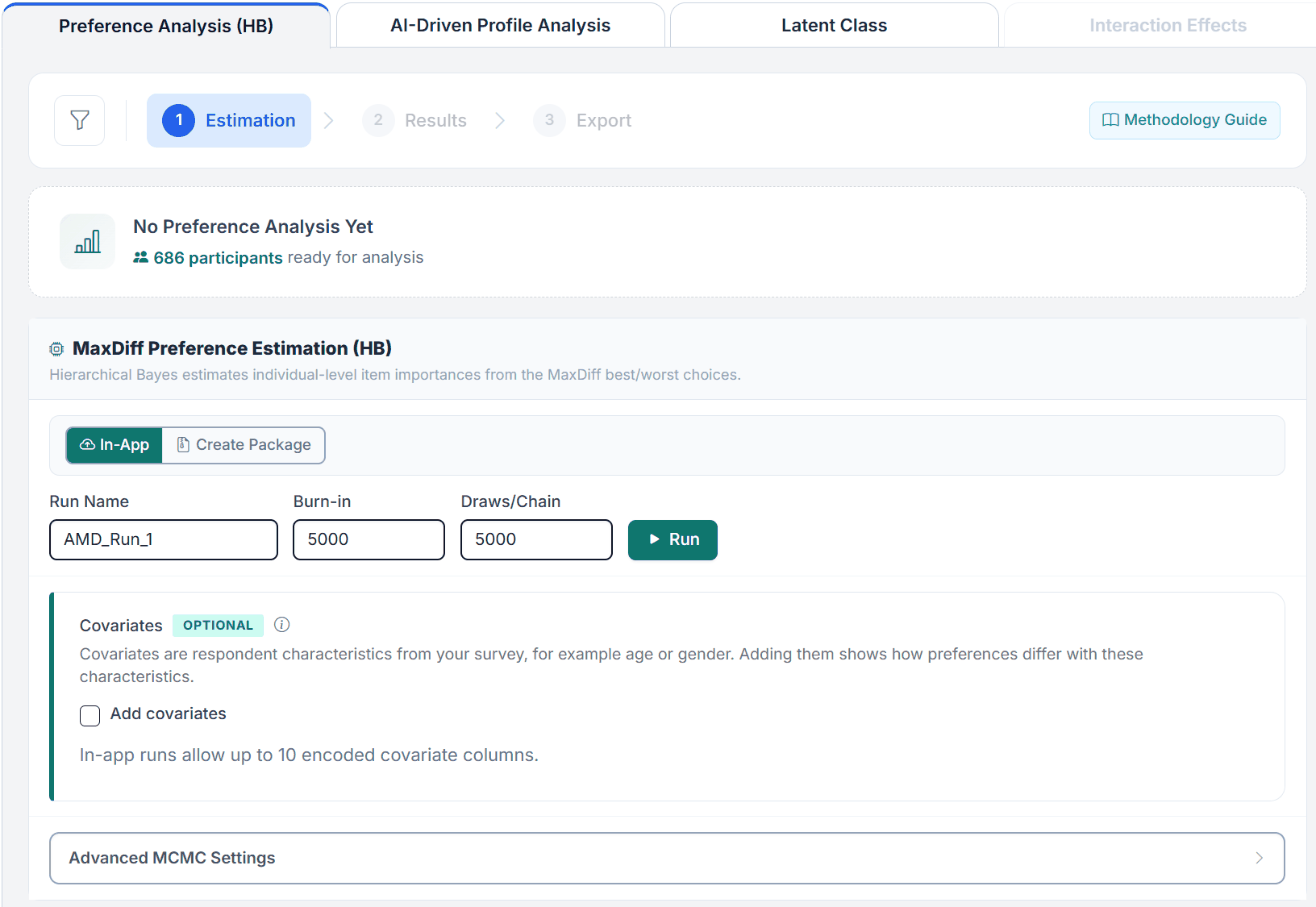
Figure 10. The estimation card for the Pizza Anchored MaxDiff before the first run (686 participants ready, Run Name AMD_Run_1, defaults 5,000 / 5,000).
Run Name, Burn-in and Draws/Chain (5,000 each by default).
In-App or Create Package. The package contains the calibration answers (data/anchor_calibration.csv) and estimates the threshold jointly, like the in-app run. When you import results, include Anchor_Thresholds.csv; without it Choicery falls back to a post-hoc maximum-likelihood threshold per respondent.
Covariates (optional; the panel states the in-app limit, "In-app runs allow up to 10 encoded covariate columns" in Figure 10). Anchored runs also report a covariate effect on the threshold.
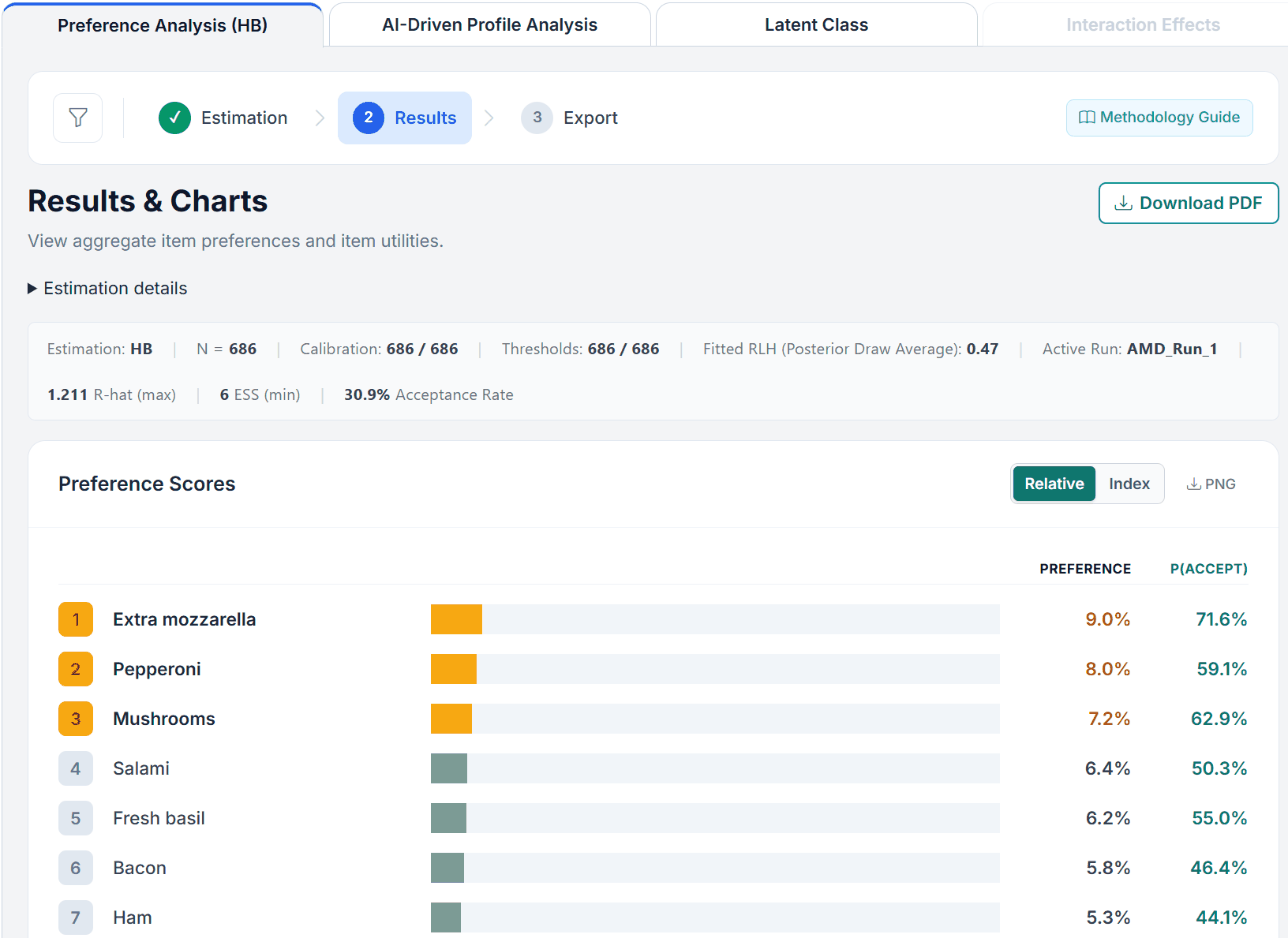
Figure 11. Results of the Pizza anchored run AMD_Run_1 (50,000 burn-in, 5,000 draws per chain): N = 686, Calibration 686 / 686, Thresholds 686 / 686, Fitted RLH 0.47, R-hat (max) 1.211, ESS (min) 6. Preference Scores in the Relative view with the P(Accept) column. The run is not converged and only shows the layout.
Convergence and calibration coverage first
The meta bar shows Fitted RLH (Posterior Draw Average), R-hat (max), ESS (min) and the Acceptance Rate as in plain MaxDiff, plus two anchored counters. R-hat must be below 1.1 (below 1.05 is good); the Pizza demo run (1.211, ESS 6, only 5,000 draws per chain) is not there yet. Its worst value belongs to a variance term (Sigma); such terms mix slowly and need many more draws, as the MaxDiff guide explains. RLH chance is 1 / items per task (0.25 with 4 items).
Calibration: respondents whose calibration answers could be matched to their best-worst data. If it is below N, Choicery warns you to check response and design consistency.
Thresholds: respondents with an individual anchor threshold. In an in-app run it equals Calibration; a lower count only appears when an imported run had to fall back to post-hoc anchoring, and a note under the meta bar says so.
Respondents who answered Yes to all or No to all
A respondent who gave the same answer to every calibration item does not pin the threshold down; in the joint HB fit the threshold is shrunk toward the population. Such respondents are usually removed in research practice, so Choicery leaves them out by default: the Filter tab has the switch Exclude participants who answered Yes to all or No to all anchor questions (only in projects with an Anchored MaxDiff block), on unless you turn it off. The rule is checked per block: a respondent is left out of a block when at least two anchor questions of that block were answered and all answers are Yes, or all are No. The Filter tab shows the count, for example "8 excluded: 3 all Yes, 5 all No"; the MaxDiff Results Excel lists the switch and the count in the Settings Summary sheet.
The switch only affects analyses; exports and the Data Editor keep every respondent. With the switch on, P(Accept), consideration sets and TURF reach come from the remaining respondents. Someone who rejects the whole category is then not counted. If those people matter, turn the switch off; their thresholds are then estimated as prior-shrunk and marked in the Identification Status column of maxdiff_Anchor_Thresholds.csv.
Reading preference and acceptance together
The Relative view shows two columns. Preference is the ordinary MaxDiff share (sums to 100 percent). P(Accept) is the share of respondents whose utility for the item lies above their threshold; it is independent per item and does not sum to 100 percent. The Index view rescales Preference so the average item is 100.
The two readings can disagree, which is the point of anchoring. In Figure 11, Pepperoni ranks second on Preference (8.0 percent) ahead of Mushrooms (7.2 percent), but fewer respondents accept it (P(Accept) 59.1 vs 62.9 percent). Salami sits almost exactly on the line (50.3 percent); a small change in wording or sample could move it either way. Items far from 50 percent are safe calls.
The Anchor Analysis page
The MaxDiff Simulation (header navigation) has a page Anchor Analysis for anchored runs:
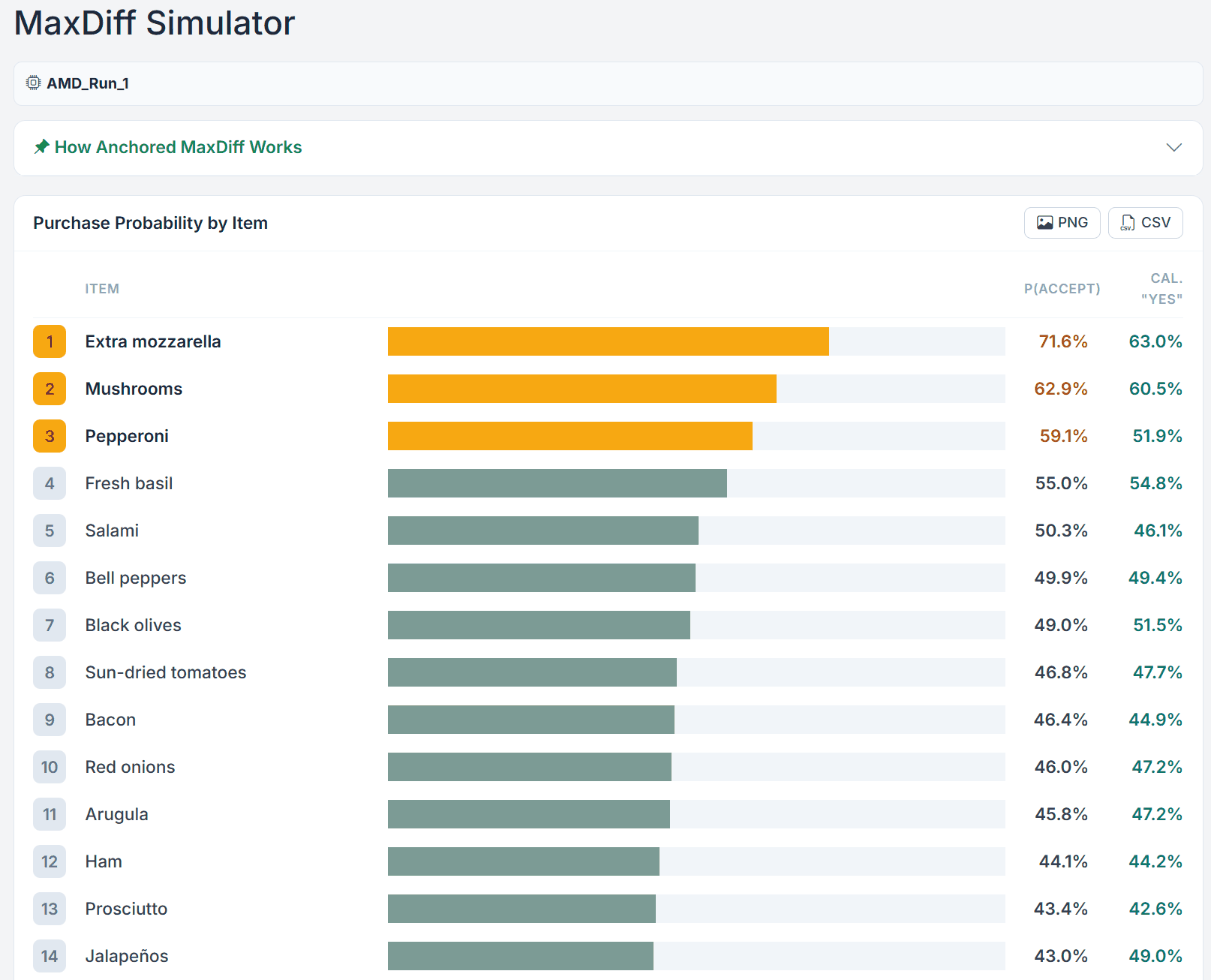
Purchase Probability by Item: P(Accept) next to the raw calibration Yes rate ("Cal. Yes"). They can differ because the model smooths individual noise.
Anchor Threshold: mean, standard deviation, minimum and maximum of the individual thresholds.
Consideration Sets: per respondent the items with P(Accept) above 50 percent, and the distribution of set sizes.
Figure 12. Purchase Probability by Item for the Pizza run AMD_Run_1: Extra mozzarella 71.6 percent P(Accept) against 63.0 percent raw Yes answers, Mushrooms 62.9 against 60.5, Pepperoni 59.1 against 51.9. Each card exports as PNG or CSV.
Downloads
On the Export step, MaxDiff Results (Excel) carries four extra sheets: Anchor Summary, Purchase Probability, Anchored Utilities (utility minus the respondent's threshold) and Consideration Sets; the anchor figures are also added to the Settings Summary. Anchored MaxDiff Responses (Long Format) is a ZIP with three files that the download card calls data.csv, attributes.csv and calibration.csv; the actual file names carry a prefix with label, task and design code (for example <label>_<task>_<code>_data.csv). The ZIP can be imported again.
Next step: MaxDiff Simulation
For anchored runs the TURF reach can use Calibration "Yes" answers (raw) or Utility above anchor (model-based). See the MaxDiff Simulation guide.
9. Best Practices & Pitfalls
Do
Add the anchor only when a go or no-go decision depends on it.
Word the calibration question as a clear, absolute Yes/No that matches the decision; keep it identical across waves.
Show 4 to 5 items per task and plan about 3 × K / k tasks.
Walk through the whole preview, including the calibration step.
Check R-hat, RLH and the Calibration and Thresholds counters before reporting.
Report items near 50 percent P(Accept) as borderline.
Include Anchor_Thresholds.csv when you import a replication package.
Do not
Do not phrase the calibration question as a comparison.
Do not leave the default question unchanged when it does not fit your items ("purchasing or using this item" rarely fits a topping list).
Do not compare anchored scores across studies unless the calibration question was identical.
Do not drop the relative ranking from the report; the two readings answer different questions.
Do not let the list grow without need: every item adds a calibration row.
Part II
Theoretical Background
Best-worst scaling, the relative-scale problem, and how a threshold anchor produces absolute scores.
10. Key Definitions
MaxDiff (best-worst scaling)
Respondents pick the best and the worst item from a subset, repeated over balanced subsets, to recover how much each item is preferred. Introduced by Finn and Louviere (1992).
Item utility
The preference for a single item, estimated per respondent.
Relative scale
A scale with meaningful differences but no fixed zero of "acceptable". Plain MaxDiff scores are relative.
Anchor (threshold)
A reference point on the utility scale, estimated per respondent from the calibration answers, that marks the boundary between accepted and not accepted items.
Anchored score
An item utility minus the respondent's threshold: positive above, negative below.
Direct binary anchoring
The anchor as a Yes/No judgment about each item on a separate screen after the best-worst tasks (Lattery, 2010). The method used in Choicery.
Indirect (dual-response) anchoring
The anchor inside each task, with a follow-up such as "are all, some or none of these important?" (Louviere; Orme, 2009).
Status-quo anchor
A "would not buy any" alternative inside each set (Schramm et al., 2025).
Hierarchical Bayes (HB)
Estimation that models each respondent's utilities as drawn from a population distribution.
11. Best-Worst Scaling & the MaxDiff Model
Best-worst scaling (Finn & Louviere, 1992; Louviere & Woodworth, 1983) rests on random utility theory (McFadden, 1974). Each item i has a latent utility for respondent h; the respondent picks the highest-utility item as best and the lowest as worst. Marley and Louviere (2005) formalised the probabilistic models. Choicery uses the sequential best-worst logit: the best pick is a multinomial logit over the items in the set, and the worst pick is the same logit on the negated utilities:
P(best = i | S) = exp(λi) / Σk in S exp(λk) P(worst = j | S) = exp(−λj) / Σk in S exp(−λk)
Best and worst choice probabilities. λ is the item's latent utility. The RLH chance level is one over the number of items per set.
This is the multinomial-logit likelihood of the whole CBC family; only the construction of the observations differs. Because respondents choose rather than rate, the scores avoid scale-use bias (Cohen & Neira, 2003; Chrzan & Orme, 2019).
12. The Relative-Scale Problem & Anchoring Methods
MaxDiff only asks people to compare items with one another. Comparisons fix the differences between items but leave the origin free: you can shift every item up or down together without changing a single best-worst probability. Anchoring adds one piece of absolute information to fix the origin.
Indirect (dual-response) anchoring
Proposed by Jordan Louviere and described by Orme (2009), it adds a follow-up to each set: are all, some or none of these items important (or would you buy them)? A "none" says every shown item lies below the anchor; a "some" says the best is above and the worst below. Orme (2020, glossary) advises not more than four items per set with this method.
Direct binary anchoring
Lattery (2010) proposed asking directly, item by item, whether each item is above the threshold, as Yes/No after all sets. It needs one extra screen. This is the method Choicery implements, with all items of the design on the screen, as Schramm et al. (2025, p. 39) recommend for the direct anchor.
Status-quo and limit-card anchors
A status-quo anchor adds a "would not buy any" alternative to each set. Schramm et al. (2025) also tested a new limit-card anchor. They compared both with the direct and indirect anchors (see section 5). Choicery offers neither.
Calibration-question anchoring
Rating-scale calibration questions are also cited as anchors (Orme, 2020, ch. 12.5, citing Bacon et al., 2007; Orme, 2009; Lattery, 2010; Horne et al., 2012), but not evaluated there. Choicery uses the binary screen.
Why the method changes the count above the line
Methods do not agree on how many items clear the threshold. In Schramm and Lichters (2024), the indirect anchor produced a much higher no-buy probability than the direct anchor, and the direct anchor predicted larger consideration sets; their predictive validity was comparable. Which anchor predicts best depends on the goal (Schramm et al., 2025). Neither is simply correct.
13. From Anchor to Absolute Scores
The anchor is an extra threshold parameter per respondent, estimated on the same utility scale as the items, not an extra item in the sets. The best-worst choices follow the likelihood of section 11; each Yes/No answer is a comparison between the item and the threshold a:
P(yes on item i) = exp(λi) / (exp(λi) + exp(a))
The calibration answer as a binary logit against the threshold a, one threshold per respondent.
Because both kinds of answers are fitted jointly, a is in the same units as the item utilities. Shifting by the anchor gives the anchored score:
anchoredi = λi − a
Positive means above the threshold, negative below, zero at the boundary.
The shift keeps every difference the best-worst data produced and adds a meaningful zero. The same difference gives P(Accept) = sigmoid(λi − a), and the consideration set is the items with P(Accept) above 0.5.
Two caveats. First, a respondent with all Yes or all No gives no information about their own line; the joint HB fit still estimates the threshold, shrunk toward the population, and records it as prior-shrunk. Second, the joint fit needs the calibration answers at estimation time. In the app and in the replication package the threshold is sampled inside the HB run. Only when results arrive without Anchor_Thresholds.csv, or for older cached runs, does Choicery estimate each threshold afterwards by maximum likelihood from the calibration answers and the fitted utilities.
Why the joint fit matters
Estimating the best-worst utilities first and adding a threshold later would leave the origin arbitrary. Fitting both together puts the item utilities and the anchor on one shared scale, so "above zero" has a fixed meaning.
Best-worst only: utilities known up to a free shift (no zero).
Anchor answers only: a Yes/No per item (no spacing).
Joint fit: spacing from best-worst + zero from the anchor.
14. Experimental Design
The best-worst part uses the design of plain MaxDiff: items about equally often, pairs about equally often together, items spread over the screen positions, and many versions so no respondent carries the whole design. Choicery's Balanced generator makes item counts exactly equal when versions × tasks × items per task is divisible by the number of items and otherwise lets them differ by at most one; it then balances pairs, versions and positions (see the MaxDiff guide). The Design Diagnostics report the achieved values.
The calibration adds no combinatorial design: one screen with every item of the design once, in a random order per participant. Its only design decision is the wording of the Yes/No question. The number of calibration rows equals the number of items, one more reason to keep the list focused.
15. References
Chrzan, K., & Orme, B. K. (2019). Applied MaxDiff: A practitioner's guide to best-worst scaling.
Cohen, S. H., & Neira, L. (2003). Measuring preference for product benefits across countries: Overcoming scale usage bias with maximum difference scaling. Paper presented at the ESOMAR Latin America Conference, Punta del Este, Uruguay.
Finn, A., & Louviere, J. J. (1992). Determining the appropriate response to evidence of public concern: The case of food safety. Journal of Public Policy & Marketing, 11(2), 12-25.
Horne, J., Rayner, B., Baker, R., & Lenart, S. (2012). Continued investigation into the role of the anchor in MaxDiff and related tradeoff exercises. Conference paper.
Lattery, K. (2010). Anchoring maximum difference scaling against a threshold: Dual response and direct binary responses. Conference paper (pp. 91-106).
Louviere, J. J., Flynn, T. N., & Marley, A. A. J. (2015). Best-worst scaling: Theory, methods and applications. Cambridge: Cambridge University Press.
Louviere, J. J., & Woodworth, G. (1983). Design and analysis of simulated consumer choice or allocation experiments: An approach based on aggregate data. Journal of Marketing Research, 20(4), 350-367.
Marley, A. A. J., & Louviere, J. J. (2005). Some probabilistic models of best, worst, and best-worst choices. Journal of Mathematical Psychology, 49(6), 464-480.
McFadden, D. (1974). Conditional logit analysis of qualitative choice behavior. In P. Zarembka (Ed.), Frontiers in econometrics (pp. 105-142). New York: Academic Press.
Orme, B. K. (2009). Anchored scaling in MaxDiff using dual-response.
Orme, B. K. (2020). Getting started with conjoint analysis: Strategies for product design and pricing research (4th ed.). Manhattan Beach, CA: Research Publishers.
Rao, V. R. (2026). Applied conjoint analysis: From product and service design to market and pricing strategies (2nd ed.). Springer. (Chapter 16 is written by B. Orme.)
Schramm, J. B., & Lichters, M. (2024). Incentive alignment in anchored MaxDiff yields superior predictive validity. Marketing Letters, 36(1), 1-16 (2025 issue). https://doi.org/10.1007/s11002-023-09714-2
Schramm, J. B., Lichters, M., & Guhl, D. (2025). Anchoring methods for MaxDiff and their predictive validity in product choice. SSRN preprint 5674983, not peer reviewed.