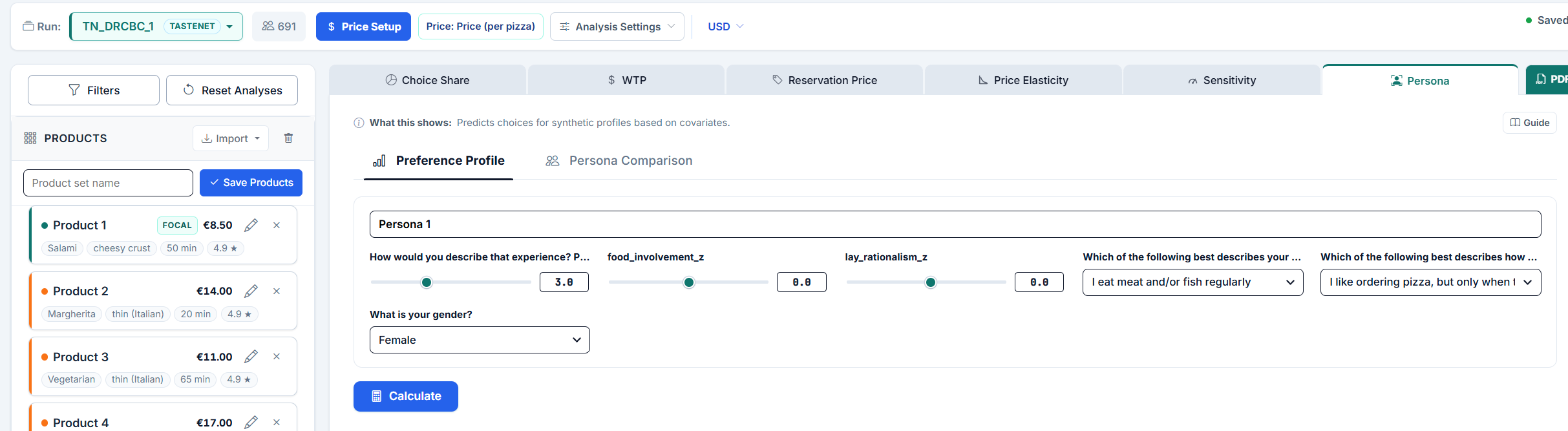
Predict preferences for synthetic profiles by setting demographic and attitudinal covariates, a practical guide for Choicery with methodological background.
Step-by-step instructions for running Persona Simulation in Choicery.
Persona Simulation predicts what an arbitrary, hypothetical respondent would prefer, based on the covariate-to-preference mapping learned by a trained AI-Driven Profile Analysis model (TasteNet). You build a "persona" by setting demographic and attitudinal covariates (age, gender, income, attitude scores, etc.), and Choicery returns the predicted utilities, attribute importances, and (if products are configured) the choice probabilities for that synthetic profile.
Unlike Market Simulation (which averages choice probabilities across the actual sample) or HB results (which give one utility vector per real respondent), Persona Simulation lets you ask "what would a 28-year-old urban professional who scores high on sustainability prefer?", even if no such person was in the sample.
A coffee machine manufacturer trains a TasteNet model with age, gender, children (Yes/No) and an 8-item personality scale as covariates. With Persona Simulation, the team can ask: "What does a 45-year-old woman with children and a high openness score prefer in terms of price tier, milk system, and design?" The persona builder produces the predicted utility profile and, if products are defined, the share of preference for each product.
Persona utilities (part-worths and importances) use only the covariate-driven component f(z) of the TasteNet model. The hybrid residual (unobserved heterogeneity) cannot be inferred for a profile that was never observed, so the utilities show it at its prior mean (typically zero). Choice probabilities are different: they are averaged over random draws of that residual, so they are not simply the softmax of the displayed utilities (Section 4.6). Interpret persona outputs as "systematic preference shifts driven by observable characteristics", not as a full individual posterior. See Section 9 for the formal explanation.
A completed TasteNet (AI-Driven Profile Analysis) run with saved model. Persona Simulation is the only simulation module that requires TasteNet specifically. Plain HB runs do not expose a covariate-to-preference mapping at the per-respondent level.
At least one covariate selected during the TasteNet run. The persona builder shows one input per covariate the model was trained on. A TasteNet run with zero covariates produces an empty persona form and no useful predictions.
(Optional) Products defined in the Products panel on the left of the Market Simulator. Required only if you want product choice probabilities, and required in Persona Comparison mode. Without products, Preference Profile mode still shows the persona's utility profile (importances and zero-centered part-worths).
The TasteNet run must be selected as the active source in the Market Simulator's run picker (the Run: dropdown above the panels). If the active run is a plain HB run, opening the Persona tab shows the notice "Persona Simulation Not Available" with the reason "The selected run is not a TasteNet run. Choose a TasteNet run from the Run menu to use Persona Simulation." The tab itself is only disabled when the project has no completed analysis run at all.
Open the project, go to Analysis → Market Simulator, and switch the tab on the right-hand results panel to Persona. Persona content only appears when the currently selected analysis run is an AI-Driven Profile Analysis (TasteNet) run whose model weights and covariate metadata were saved with the run.
The Persona panel offers two sub-modes, selected via the two sub-tabs at the top of the tab content:
Use Preference Profile when you want to deeply understand one persona. Use Persona Comparison when you want to contrast two or more personas head to head on a defined product portfolio.
Each persona is a card with an editable name field at the top (pre-filled with "Persona 1", "Persona 2", and so on) and one input per covariate. The covariate inputs are ordered with all numeric covariates first, then all categorical ones. Each input is labelled with the question label of the survey variable the covariate came from (the raw variable name is used when no label is stored, and it is always available in the tooltip of the label).

In Persona Comparison mode, the Add Persona button below the cards is active and each card gets a remove button in its header. The button is disabled once five personas exist, with the tooltip "Maximum 5 personas reached". At least one card always remains.
Numeric covariate inputs are bounded by the range observed during training, so you cannot build an extrapolating persona through the persona builder. A server-side check still compares every numeric value against the recorded [min, max] and returns an extrapolation warning banner above the results if a value falls outside. Treat such a result with caution: the prediction is then outside the data the model was actually fit on. See Section 11.
Pick the sub-mode (Preference Profile or Persona Comparison).
Configure one persona (or several, in Comparison mode).
(Optional in Preference Profile, required in Persona Comparison) Define or adjust products in the Products panel on the left. In Persona Comparison mode a hint line reading "Configure products in the left panel to enable product preference analysis." sits under the sub-tabs, and Calculate stays disabled until at least one product exists.
Click Calculate. Persona Simulation is one forward pass through the trained neural network per profile (plus a fixed number of residual draws for the choice probabilities, see Section 4.6), so results appear in a fraction of a second.
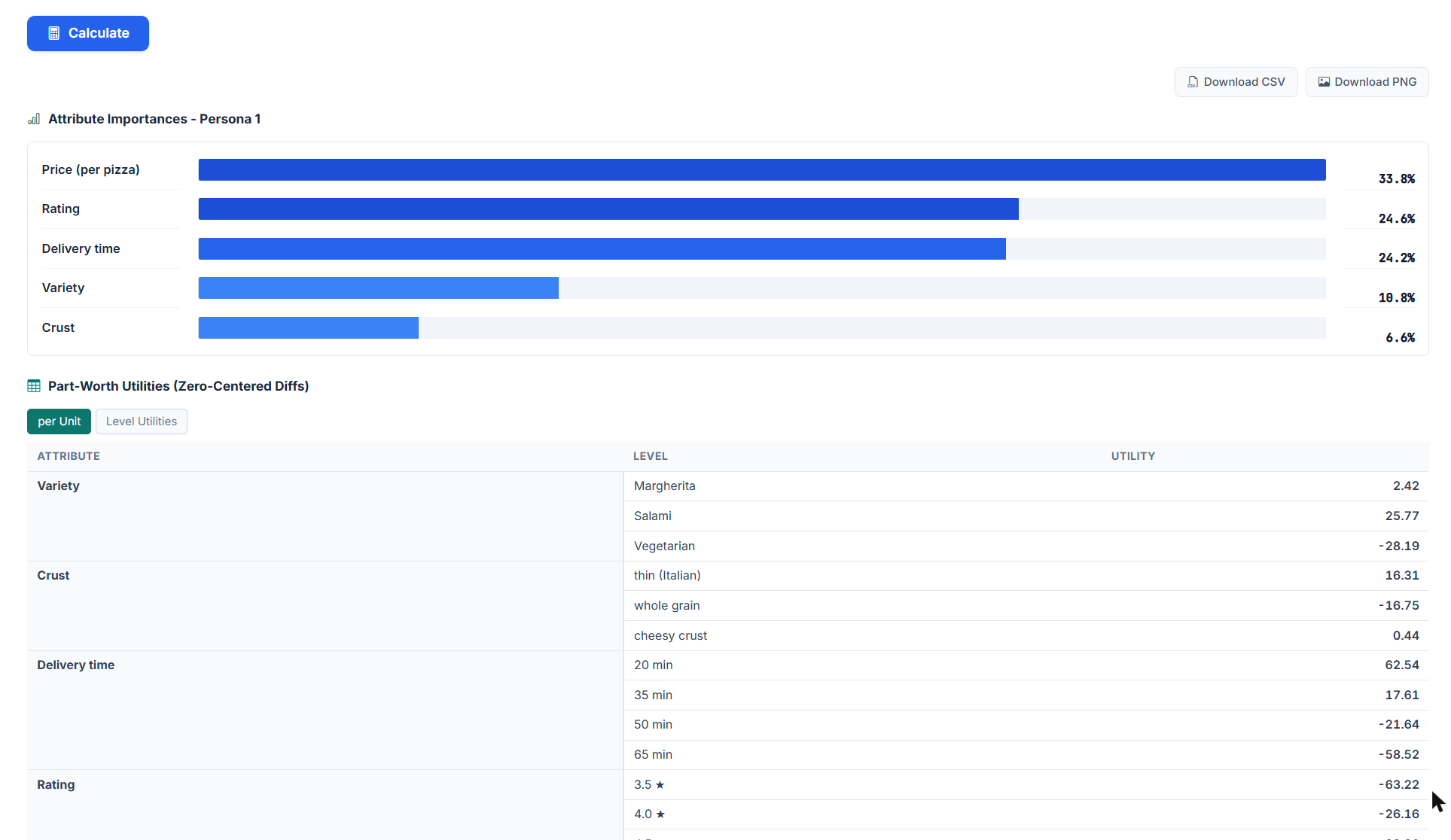
The first result section is headed Attribute Importances followed by the persona's name. Attributes are sorted from strongest to weakest, each with a horizontal bar and a percentage. Importances sum to 100% across attributes within one persona, and the bars are scaled relative to the strongest attribute, so the top attribute always fills the track. They answer: "for this persona, which attributes drive the choice the most?"
The same attribute can have very different importance values across personas. A price-sensitive persona may show 50% on Price, while a status-driven persona may show only 15%. That is exactly the contrast the comparison mode is designed to surface.
The next section, Part-Worth Utilities (Zero-Centered Diffs), is a table with the columns Attribute, Level and Utility. Values are on the zero-centered diffs (ZC) scale: the raw part-worths are multiplied by 100 divided by the average attribute range, which makes them comparable across attributes and across personas. A ZC value of +30 for "Milk system = automatic" means that level sits 30 ZC points above the attribute mean; a value of -25 for "Capacity = 4 cups" means it sits 25 below. If the run has a None option, it is appended as an extra row labelled None / No choice.
When the run contains at least one linear attribute (typically price), a small toggle appears above the table with two options, per Unit (default) and Level Utilities. "per Unit" shows the single slope, the utility change per unit of the raw variable, labelled "per unit". "Level Utilities" replaces that row with the implied utilities at the design levels, so the linear attribute reads like a categorical one.
When products are configured in the left panel, Preference Profile mode appends a section headed Product Preferences plus the persona's name, with one share bar per product. Probabilities sum to 100% across all products (plus the None option, when the Include "None" switch in the left panel is on and the run has a None option). The leading product is highlighted, the None option is shaded, and the bars use the same styling as the Choice Share tab. This answers "out of these specific products, which one is most likely to win, for this persona?"
Under each share a note states how the probabilities were computed. For runs that persist a residual heterogeneity estimate (Neural-HB), the share is the mean over residual draws and a P5-P95 line shows the uncertainty band (Section 4.6). For runs without such an estimate, the note says that the share is the point prediction and that no band is available. The simulation method chosen on the Choice Share tab (first choice or randomized first choice) does not apply to personas.
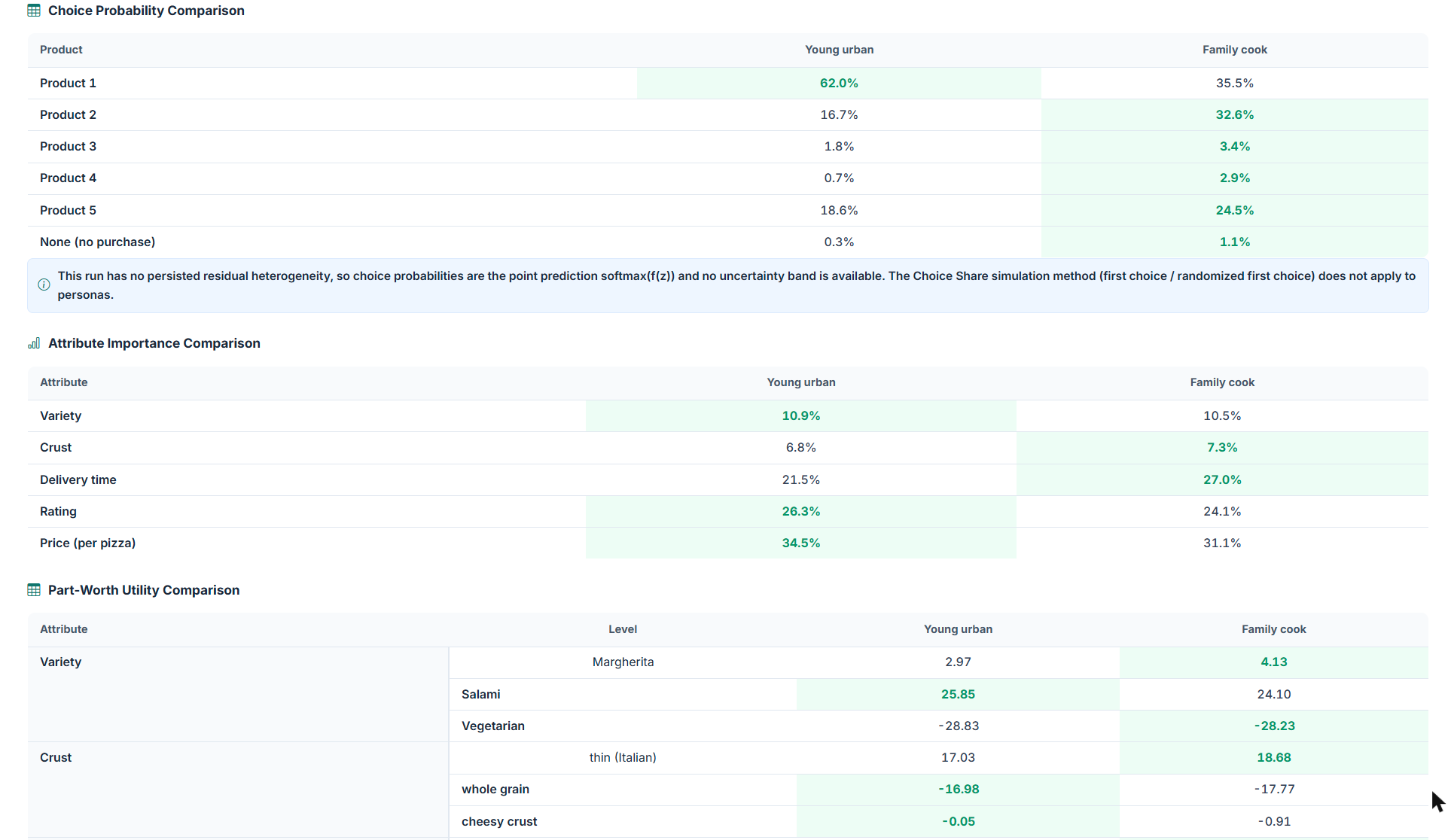
Persona Comparison mode renders comparison tables rather than per-persona panels: one column per persona, with the highest value in each row highlighted. You get Choice Probability Comparison (one row per product, only when products are configured), Attribute Importance Comparison (one row per attribute) and Part-Worth Utility Comparison (one row per attribute and level, using the implied level utilities for linear attributes). This is what makes the underlying preference heterogeneity legible: you see at a glance that, say, Product A wins 55% with Persona 1 but only 18% with Persona 2.
Above every result, Choicery renders two buttons, Download CSV and Download PNG. The CSV starts with a "Persona Settings" block that lists the covariate values you entered, one column per persona, followed by "Attribute Importances (%)", "Part-Worth Utilities (Zero-Centered Diffs)" and, if products were configured, "Product Preferences (%)". The PNG is a high-resolution capture of the result area with the two buttons hidden. Both files are named after the persona (or persona_comparison_) plus a timestamp.
The PDF button at the right end of the tab bar exports the currently visible tab. For the Persona tab the report contains a Persona Configuration card per persona, in which categorical codes are resolved back to the survey option labels (a stored code of 2 appears as "Female"), followed by the Attribute Importances card, the Part-Worth Utilities (Zero-Centered Diffs) card and, when products were configured, a Product Preferences card with the same note on the probability method. Extrapolation warnings are printed in a Warnings card above the configuration. The on-screen panel itself shows results only, so the configuration record lives in the CSV and in the PDF.
The persona's part-worths are the point prediction f(z). Its choice probabilities are not the softmax of those part-worths. A real person with this profile also carries an unexplained residual h, and because the logit choice rule is nonlinear, the expected share E[softmax(f(z) + h)] differs from softmax(f(z)): expectation and softmax do not commute. The model's predicted share for the profile is the expectation, so the draws are needed to compute it; the point softmax is not that share. The direction and size of the difference depend on the part-worths and on the covariance of h. With mild independent noise the leading product typically loses share to the others, but the opposite can happen too: with strongly heterogeneous zero-sum residuals (for example [e, -e/2, -e/2] with a large SD of e on part-worths [1, 0.9, 0.9]) the leader's expected share rises above its point softmax. Treat "the point softmax overstates the leader" as one possible case, not as a rule.
Craw is the population covariance of the individual deviation that a Neural-HB run estimates (diagonal plus low-rank part) and persists with its results. Each draw is then pushed through the model's own transformation, the same one that produces a respondent's utilities: the sign constraints (softplus), the division by the utility temperature τ, and the effects-coding expansion to one entry per level (the levels of one attribute sum to zero, and the cross-parameter correlation of Craw is preserved). The persona is the average-scale respondent at its covariates (respondent scale γ = 1). Because the constraint is applied after the draw, no draw can violate it: a price slope constrained to be negative is negative in every draw, which additive noise on the constrained utilities cannot guarantee. The draws use an eigendecomposition of Craw with negative eigenvalues clipped to zero.
residual_space: raw is the standard for Neural-HB runs that persist the raw covariance (the neural_hb_raw_residual_covariance block of the results, with its CSV twin neural_hb_population_delta_covariance_raw.csv as the second source). Runs without it fall back to additive draws N(0, Σ) on the constrained, temperature-scaled utilities: from the full persisted covariance of the expanded parameters (residual_space: expanded_full) or, when only the residual standard deviation per parameter exists, from independent marginal draws (expanded_diagonal). In both fallbacks a constrained draw can cross its sign bound, and the diagonal variant also ignores the effects-coding dependence between the levels of one attribute and any correlation between parameters, so bands and mean shares are approximate there. residual_covariance: full or diagonal remains as the label of the covariance kind. Runs without any residual export (standard TasteNet without a residual component, or older runs) fall back to the point prediction softmax(f(z)). The result then carries no band and the note under the shares says so explicitly.Ranged personas. The persona builder has no range control, so personas built in the UI are always point personas. A numeric covariate can, however, arrive as a range (a minimum and a maximum instead of one value) through the persona API payload or a saved result. Choicery then evaluates the persona on a ceteris-paribus grid: the ranged covariate is varied over 25 evenly spaced values from the minimum to the maximum, while every other covariate stays at the persona's fixed value. Each grid profile is predicted by the network, and the reported values are the means across these 25 profiles. When several covariates are ranged, each one gets its own 25-point grid and the grids are paired with a staggered offset, so the profile count stays at 25 instead of growing as a full factorial.
For a ranged persona every value (importance, part-worth, share) shows a second line labelled profiles with the minimum and maximum across the 25 grid profiles. This is the range across the sampled profiles: how far the value moves when the ranged covariate travels from its minimum to its maximum. It says nothing about estimation or residual uncertainty. The P5-P95 line, which appears only under choice probabilities, is the uncertainty band across the residual draws; for a ranged persona it pools the draws of all grid profiles, so it describes the share distribution of the whole ranged population. Point personas (no range) show the P5-P95 band only.
A coffee machine project trains a TasteNet model on three covariates: age (numeric), children (Yes/No), personality_openness (1 to 5 mean of 4 items). Two personas are defined:
Choicery returns the following importance profiles:
| Attribute | Family Buyer | Design Lover |
|---|---|---|
| Price | 48% | 22% |
| Capacity | 30% | 14% |
| Milk system | 14% | 20% |
| Design line | 8% | 44% |
The contrast is exactly what the substantive theory expects. The Family Buyer is dominated by Price and Capacity (big family pot, low cost per cup). The Design Lover ranks Design line as the top driver and is far less price-sensitive. Choice probabilities on a 3-product set would then reflect these importance profiles: a basic, high-capacity machine wins among Family Buyers; a designer espresso machine wins among Design Lovers.
| Step | Check |
|---|---|
| 1 | TasteNet run completed with saved model and at least one covariate? |
| 2 | Persona tab opens with the persona builder instead of the "Persona Simulation Not Available" notice? |
| 3 | Personas pre-registered, anchored in observed data, no extrapolation warning banner? |
| 4 | Products defined (only if comparing choice probabilities)? |
| 5 | Configuration reported alongside the result charts (CSV "Persona Settings" block or the Persona Configuration card in the PDF)? |
Model decomposition, residuals, and the formal justification for the covariate-only persona prediction.
z (demographics, attitudes, etc.). A persona need not correspond to any actual respondent.z to that respondent's utility part-worths via a feed-forward neural network βn = f(zn; θ), with optional per-respondent residual hn.z.TasteNet and related neural-embedded choice models (Sifringer, Lurkin, & Alahi, 2020; Han, Pereira, Ben-Akiva, & Zegras, 2022; Wang, Wang, & Zhao, 2020) decompose each respondent's utility part-worths into two parts:
The two components have very different epistemic status:
z. Given any covariate vector (including one for a synthetic persona), evaluating f is just a forward pass through the trained network. Fully recoverable.
During training with a hybrid mode (random_effects_map, hybrid, neural_hb, etc.), the residuals hn are estimated jointly with the network. The Choice simulation tabs (Choice Share, WTP, Reservation Price, Price Elasticity, Sensitivity) all use the full hybrid utilities βn = f(zn) + hn, because for those modules every "respondent" the simulator iterates over is a real respondent with a real estimated hn.
A persona is a synthetic profile with no choice data attached. There is no posterior to draw from, because there is no likelihood contribution from this person. The best the model can do is set the residual to its prior mean:
In other words, the persona's part-worths are the population-average shift implied by the covariates, with the unexplained part of preference heterogeneity collapsed to zero. This is the right answer if your question is "what does the model say about a person with these characteristics on average?", but it is the wrong answer if your question is "what does a specific real person with these characteristics prefer?", because real persons have their own non-zero hn.
For choice probabilities the prior mean is not enough, because the choice rule is nonlinear: the expected share of the population with this profile is E[softmax(f(z) + h)], not softmax(f(z)). Choicery therefore integrates the residual out numerically, drawing h from its persisted prior N(0, Σ) (the full covariance over the expanded parameters, or independent marginal SDs when only those are persisted) and averaging the softmax over the draws (Section 4.6). The band around the share is the spread of those draws. This still uses no choice data from the persona; it only uses the estimated size of the unexplained heterogeneity.
This is why the "Covariate-only utilities" banner is shown at the top of the Persona tab whenever the active run was estimated with a hybrid residual (the run's hybrid mode is one of random effects, hybrid or Neural-HB). Covariate-only utilities always apply, but the missing-residual note only matters if the fitted model actually has a residual component. The banner makes the assumption explicit, so users do not over-interpret the persona output as "individual-level prediction with full heterogeneity".
Persona Simulation answers: "holding all observed covariates at these values, what utility profile does the model predict on average?" It does NOT answer: "what would any specific real respondent with these covariates prefer?". The first question is a systematic-covariate-shift question, the second requires individual choice data.
Hierarchical Bayes (HB) estimation in Choicery also supports upper-level covariates. The covariate panel on the HB estimation screen carries the notice "Covariate estimation is currently available in Create Package mode only" unless in-app covariate estimation has been enabled for the account, in which case in-app runs allow a limited number of encoded covariate columns. At first glance the two features look similar, but they answer different questions and operate at different layers of the model.
| Dimension | HB Upper-Level Covariates | Persona Simulation (TasteNet) |
|---|---|---|
| Model layer | Population-mean of β regressed on covariates as a second Gibbs step | Per-individual β modeled as a non-linear function f(z) inside a neural network |
| Functional form | Linear regression of mean utilities on covariates | Arbitrary non-linear mapping learned end-to-end |
| Output for analyst | Covariate-effect summary tables (effect of age, gender, etc., on each part-worth) | Full predicted utility profile for any specified persona |
| Synthetic profile prediction | Not directly supported in the UI | Native, this IS the feature |
| Captures interactions between covariates? | Only if explicitly added as interaction terms | Automatically, via hidden layers |
| Required run type | HB with covariates (Create Package mode, or in-app when enabled) | TasteNet (AI-Driven Profile Analysis) with saved model |
Use HB upper-level covariates when you want a parametric, easily reported summary of "how do covariates move the mean preferences?" Use Persona Simulation when you want to query the model with a specific covariate combination and see the predicted preference profile, including non-linear interactions that the network may have learned.
Neural networks do not extrapolate gracefully. Outside the range of covariate values seen during training, the trained f(z) can drift in directions that have no statistical or substantive justification. A persona with age = 95 in a sample that only covered ages 18 to 75 will get a utility profile, but that profile is the network's invented behavior, not a learned regularity.
Choicery guards against this on two levels. In the persona builder, the slider and the value box of every numeric covariate are bounded by the per-variable minimum and maximum observed during training (read from Covariate_Values_Used.csv inside the run directory, with a fallback of mean plus or minus three standard deviations when that file is missing), and a typed value outside the bounds is clamped on blur. On the server, each submitted numeric value is compared against the same bounds, with a small tolerance for display rounding; if a value falls outside, an extrapolation warning is attached to the persona and shown as a banner above the results.
Numeric covariates that were encoded with a spline get a second, narrower check: the builder shows the line "Spline training range: a to b. Values outside this range use linear extrapolation." under the input, and the server adds a warning when a value lies outside that training range, because the observed range can include holdout respondents that never shaped the spline basis.
For categorical covariates, the persona builder only offers categories that the model was trained on, so categorical extrapolation cannot happen. Numeric covariates are the only failure mode, and the bounded inputs close that path for personas built in the UI.
The conservative practice: build personas at the medians of meaningful sub-segments (e.g. "25th percentile of age, female, urban"), and document any deviation from the observed range as a sensitivity check rather than as a headline finding.
Ben-Akiva, M., & Lerman, S. R. (1985). Discrete choice analysis: Theory and application to travel demand. Cambridge, MA: MIT Press.
Han, Y., Pereira, F. C., Ben-Akiva, M., & Zegras, C. (2022). A neural-embedded discrete choice model: Learning taste representation with strengthened model interpretability. Transportation Research Part B: Methodological, 163, 166-186. doi:10.1016/j.trb.2022.07.001
McFadden, D., & Train, K. (2000). Mixed MNL models for discrete response. Journal of Applied Econometrics, 15(5), 447-470.
Rossi, P. E., Allenby, G. M., & McCulloch, R. (2005). Bayesian statistics and marketing. Chichester, UK: John Wiley & Sons.
Sifringer, B., Lurkin, V., & Alahi, A. (2020). Enhancing discrete choice models with representation learning. Transportation Research Part B: Methodological, 140, 236-261. doi:10.1016/j.trb.2020.08.006
Train, K. E. (2009). Discrete choice methods with simulation (2nd ed.). Cambridge, UK: Cambridge University Press.
Wang, S., Wang, Q., & Zhao, J. (2020). Deep neural networks for choice analysis: Extracting complete economic information for interpretation. Transportation Research Part C: Emerging Technologies, 118, 102701. doi:10.1016/j.trc.2020.102701
Wedel, M., & Kamakura, W. A. (2000). Market segmentation: Conceptual and methodological foundations (2nd ed.). Boston, MA: Kluwer Academic Publishers.
Persona Simulation Methodology Tutorial, Choicery © 2026